Debugging HTTP Protocol
Cut Down Your Development Time with The Best-in-class HTTP Protocol Debugger
HTTP, an acronym for HyperText Transmission Protocol is an underlying protocol used by the
World Wide Web. HTTP defines how messages are transmitted and formatted, and what actions web
servers take to various commands. Like with most other web processes, HTTP can fall victim now
and again to bugs either as a result of an error in coding, the web link or some form of virus
and this is why it HTTP debugging becomes necessary.
Debugging HTTP protocol is important to web developers as sometimes web applications would malfunction and this makes debugging necessary to identify exactly where the error came from. In debugging, you first have to determine the kind of error you are getting as sometimes the kind of error message you get gives a clue as to what the problem might be. For example, when you get the famous 404 error message, it is a client-side error which means the web page you are searching for has either been removed or moved and the URL wasn’t changed accordingly, or you the user did not type in the URL correctly.
Usually, in web and internet development, you don’t have access to what is being sent and received between your web browser/client and the server, usually, via HTTP. Without this access, debugging HTTP protocol becomes difficult and time consuming for you to determine exactly where the faults are on your internet experience. However, there now exist applications, most of which operate like proxies that allow you to view all the data being sent and received from your browser.
Therefore, it makes debugging quick, reliable and precise; saving you time and frustration. For errors not as simple as the 404 error, it might mean having to check through the code manually, and this can be a lot of work, but fortunately, there are applications which make this easy by doing the debugging automatically.
There are several applications which can perform debugging HTTP protocol automatically, and the way they act is pretty much the same. HTTP Debugger, for example, a popular debugging application can locate and fix website errors and identify bottlenecks in the code; analyze HTTP headers, query strings, redirections, cookies, POST parameters, headers and error codes. It can also be used to view the source code of HTML/XML web pages and JAVA/VB scripts. HTTP debugger can also be used to analyze the HTTP traffic which comes from browser web add-ons.
 A close look at some of the features of HTTP debugger are:
Copyright Notice: Please don't copy or translate this article without prior written permission from the HTTPDebugger.com
Debugging HTTP protocol is important to web developers as sometimes web applications would malfunction and this makes debugging necessary to identify exactly where the error came from. In debugging, you first have to determine the kind of error you are getting as sometimes the kind of error message you get gives a clue as to what the problem might be. For example, when you get the famous 404 error message, it is a client-side error which means the web page you are searching for has either been removed or moved and the URL wasn’t changed accordingly, or you the user did not type in the URL correctly.
Usually, in web and internet development, you don’t have access to what is being sent and received between your web browser/client and the server, usually, via HTTP. Without this access, debugging HTTP protocol becomes difficult and time consuming for you to determine exactly where the faults are on your internet experience. However, there now exist applications, most of which operate like proxies that allow you to view all the data being sent and received from your browser.
Therefore, it makes debugging quick, reliable and precise; saving you time and frustration. For errors not as simple as the 404 error, it might mean having to check through the code manually, and this can be a lot of work, but fortunately, there are applications which make this easy by doing the debugging automatically.
There are several applications which can perform debugging HTTP protocol automatically, and the way they act is pretty much the same. HTTP Debugger, for example, a popular debugging application can locate and fix website errors and identify bottlenecks in the code; analyze HTTP headers, query strings, redirections, cookies, POST parameters, headers and error codes. It can also be used to view the source code of HTML/XML web pages and JAVA/VB scripts. HTTP debugger can also be used to analyze the HTTP traffic which comes from browser web add-ons.
A close look at some of the features of HTTP debugger are:
-
DEBUGGING HTTP API CALLS
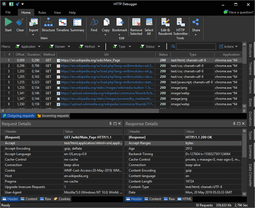
Unlike some other debuggers which act as proxies, the HTTP Debugger is a proxy-less HTTP sniffer with a clean and easy to use UI. It doesn’t change the browser configuration and can debug HTTP protocol traffic from any browser or JAVA/.NET app.
-
EDITING AND RESUBMITTING OF HTTP SESSIONS
With HTTP Debugger you can edit and resubmit tweaked HTTP sessions back to your server to determine how it handles such requests. For example, testing authorization flow with or without special headers or cookies. -
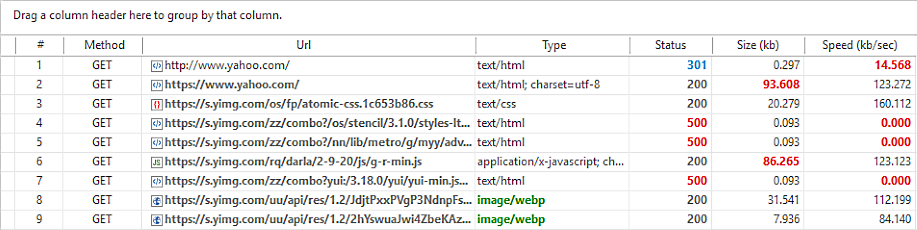
HIGHLIGHTING OF ERRORS AND SLOW REQUESTS
When sending HTTP requests, errors may occasionally arise as will slow and large requests which could take longer than normal. HTTP Debugger highlights such requests and gives you the option of creating custom highlighting rules in just one click. -
REAL-TIME VIEW OF TRAFFIC
With HTTP Debugger, your traffic stats are displayed in the form of charts where you can find the slowest, largest and most queried domains. There is also the chance for you to view the content type. -
MODIFY HTTP TRAFFIC ON THE FLY
HTTP Debugger emulates various server behaviors without having to make required changes to the code on the server side. Users can add/remove HTTP headers, redirect requests from one server to another, change HTTP content, etc. -
DEBUG ISSUES REMOTELY
HTTP Debugger can also be used to record HTTP protocol traffic locally and send session files containing the reproduction of the flow problem where they can then be accessed and debugged. -
SEE INCOMING HTTP TRAFFIC FROM LOCAL SERVERS
With HTTP Debugger you can view incoming HTTP protocol traffic to local servers powered by Apache, Node.js, IIS Express and others.
Copyright Notice: Please don't copy or translate this article without prior written permission from the HTTPDebugger.com
HTTP Debugger is a proxy-less HTTP analyzer for developers that provides the ability to capture and analyze HTTP headers,
cookies, POST params, HTTP content and CORS headers from any browser or desktop application.
Awesome UI and very easy to use. Not a proxy, no network issues!
Download FREE 7-Day Trial
HTTP Debugger
 Debug HTTP API calls to a back-end and between back-ends.
Very easy to use.
Not a proxy, no network issues!
Download Free Trial
Debug HTTP API calls to a back-end and between back-ends.
Very easy to use.
Not a proxy, no network issues!
Download Free Trial