Capture, inspect, and modify HTTP traffic
Proxy-less HTTP/HTTPS debugger for Windows. Captures HTTP/1.1, HTTP/2, WebSocket, Server-Sent Events, and gRPC from any process — browsers, desktop apps (.NET, Java, Electron), CLI tools, local servers, and AI agents — without changing system proxy settings.

Per-request views
Inspect a single request
Each captured request can be viewed in detailed Request and Response panels with dedicated viewers for HTTP headers, cookies, URL parameters, JSON and XML trees, images, syntax-highlighted bodies, hex, and request timing.
-
Summary
Connection, request, response, and compression details consolidated in one pane.
-
Content
Syntax highlighting for HTML, JSON, XML, CSS, and JavaScript request and response bodies.
-
Timeline
Connecting, Waiting, Sending, and Receiving phases per request in milliseconds.
Streaming protocols
WebSocket, Server-Sent Events, and gRPC
Inspect every frame, message, and event with full metadata — direction, offset, type, byte size, WebSocket masking and compression, and the decoded payload. Everything is captured to disk for later replay or analysis.
-
WebSocket
WebSocket frames
Per-frame direction, type, byte size, masking, compression, and decoded payload. Info and Text tabs per frame.
Read debugging guide → -
Server-Sent Events
Server-Sent Events
Per-message offsets, byte sizes, and decoded text for each SSE event.
Read debugging guide → -
gRPC
gRPC messages
gRPC over HTTP/1.1 and HTTP/2: RPC method, stream IDs, message direction, and captured request and response payloads.
Read debugging guide →
Rules
Modify and replay traffic
Edit traffic without touching code. Replay any request with the Submitter to see how the server reacts, or simulate server responses with Auto-Reply and Modify Headers to test how the client handles errors and edge cases.
-
Edit & Resubmit
Resubmit edited requests to test the server against missing cookies, tampered auth headers, SQL injection, or XSS attempts.
-
Modify Headers
Check how the client behaves when CORS, CSP, or other security headers are missing, wrong, or stripped from the server's response.
-
Auto-Reply
Swap in custom response bodies and status codes to see how the client handles unexpected, malformed, or edge-case content from the server.
Redirect TCP Connections
Redirect TCP traffic from one IP:port to another — local mocks or staging backends.
Filter
Filter captured traffic
Two layers of filtering keep the view focused. Quick filters narrow the grid on the fly; filter rules block noise from system services and other applications before it ever reaches the UI.
-
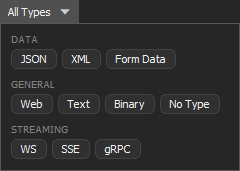
Quick filters
Narrow the grid by application, domain, or content type — JSON, XML, Form Data, Web, Text, Binary, WS, SSE, or gRPC — or use the free-text input to search across visible columns as you type.

-
Filter rules
Drop traffic by application name or URL pattern before it ever reaches the UI — no clutter from background services or unrelated apps.

Highlight
Highlight rules
HTTP Debugger automatically highlights errors, slow requests, and oversized responses. Add your own rules to highlight the requests and responses you care about, and choose whether to color just the matched cell or the entire row.
Session views
Session overviews
Session-wide charts aggregate captured traffic by host, content type, response size, and response time — understand your traffic patterns and spot optimization opportunities.
-
Top content types
MIME types ranked by total size.
-
Top requested domains
Hosts ranked by total response size.
-
Largest requests
Individual responses ranked by size.
Structure tree
Group requests by domain and path
HTTP Debugger automatically organizes captured traffic into a domain-and-path tree, tallying request counts and total bytes per node — allowing you to understand the internal structure of your traffic at a glance.
Per-request quick actions
Context menu actions
All important operations are one right-click away — act on any captured request directly from its row, without navigating menus or opening dialogs.
- Copy & bookmark requests
- Filter out or highlight similar requests
- Modify or auto-reply specific server responses
- Switch to HTTP/2 connection tree view
- Edit & submit request back to server
- Save captured content to disk
- Delete selected or all requests

Themes
Dark and light themes
Pick the theme that fits you. Use the dark theme for long debugging sessions and OLED displays, or light for screenshots, screen sharing, and bright environments.
Other features
-
Capture local server and AI agent traffic
Inspect HTTP traffic handled by Node.js, IIS Express, Apache, Kestrel, MCP servers, AI coding agents, and other processes running on localhost.
-
Export to Excel
Export captured traffic to Microsoft Excel, or save as XML, JSON, CSV, TXT, or binary.
-
Save and restore sessions
Save a full capture to disk and reload it later. Byte-for-byte the same data.
-
Free Express version for clients
Ship the free Express build to a customer or QA; get back a session file with the exact reproduction flow.
-
Request numbering
Every request is numbered chronologically. Stable references for notes, bug reports, and screenshots.
-
URL / Base64 / Hex converter
Encode and decode URL, Base64, and Hex strings without leaving the app.
-
Bookmarks
Tag requests you want to return to later — bug repro candidates, suspicious responses, slow endpoints — and jump between them with hotkeys.
-
HTTP/2 connection tree
Dig deeper into HTTP/2 sessions — see exactly how requests were multiplexed across connections and streams, and where you can optimize.
Download HTTP Debugger Pro
A proxy-less HTTP/HTTPS sniffer for Windows that captures traffic system-wide from any process.
Version 10.3 Windows 10, Windows 11