An API call returns a cryptic 500 error with no useful payload. A CORS header works in development but breaks in staging. A third-party SDK sends requests you never authorized. When browser DevTools only show traffic from a single tab, you need an HTTP sniffer — a tool that captures HTTP and HTTPS traffic across every process on your machine and decodes it into readable requests and responses.
What Is an HTTP Sniffer?
An HTTP sniffer intercepts HTTP/HTTPS traffic between clients and servers, and displays request methods, URLs, headers, status codes, cookies, and response bodies in a structured format. Unlike general-purpose packet sniffers that operate at the TCP/IP layer, an HTTP sniffer parses application-layer data, making it purpose-built for web and API debugging.
How HTTP Sniffing Works
HTTP sniffing tools use one of three capture methods, each with different tradeoffs for coverage, setup complexity, and HTTPS visibility.
Proxy-Based Capture
Proxy-based tools route traffic through a local proxy server. The application or OS must be configured to use that proxy, and HTTPS decryption requires installing a root certificate for TLS interception. This works well for browsers and proxy-aware applications but misses traffic from CLI utilities, background services, and desktop apps that ignore proxy settings.
Network Driver Capture
A network driver (kernel-level) HTTP sniffer tool hooks into the OS networking stack below the application layer. It captures traffic from all processes — browsers, desktop apps, background services, localhost — without proxy configuration or certificate installation. It also sees apps started before the sniffer, apps that ignore proxies, and traffic routed through VPN tunnels or corporate proxies.
Packet Capture (pcap)
Raw packet sniffer tools like Wireshark and tcpdump use libraries such as libpcap or Npcap to read network interface frame. They capture all protocols — not just HTTP — providing maximum visibility but requiring manual filtering and decoding. HTTPS appears encrypted unless the application exports TLS session keys. For HTTP work, the signal-to-noise ratio is low — TCP handshakes, DNS lookups, and ARP frames mix with the HTTP data you need.
HTTP Sniffer vs Packet Sniffer vs Proxy
The right capture approach depends on what traffic you need and how much setup you can accept.
| Criteria | HTTP Sniffer (Network Driver) | Packet Sniffer (pcap) | HTTP Proxy |
|---|---|---|---|
| Protocol scope | HTTP/HTTPS only | All protocols | HTTP/HTTPS only |
| Setup required | None — captures immediately | Driver install (Npcap/WinPcap) | Proxy config + root certificate |
| HTTPS decryption | Automatic | Requires TLS key export | Automatic (via MITM) |
| Non-proxy-aware apps | Captured | Captured | Missed |
| Localhost traffic | Captured | Platform-dependent | Requires loopback workarounds |
| Pre-existing connections | Captured | Captured | Missed |
| Signal-to-noise for HTTP | High — HTTP only | Low — all protocols mixed | High — HTTP only |
For HTTP-focused debugging, a dedicated sniffer or proxy delivers the cleanest signal. Packet capture is better suited for lower-level protocol analysis where non-HTTP traffic matters.
Common Use Cases for HTTP Sniffing
API and Microservice Debugging
When a REST or GraphQL call returns an unexpected result, an API sniffer shows the exact request and response — headers, query strings, POST payloads, and the full body — without adding logging code. For microservice architectures, a system-wide sniffer captures backend-to-backend calls invisible to browser DevTools: service-to-service traffic, OAuth token exchanges, and webhook deliveries. Process-name filtering isolates one service in a busy environment.
Security Auditing and HTTPS Inspection
HTTP sniffing reveals security details invisible at the browser level: missing CORS headers, cookies without
Secure or
HttpOnly, tokens leaked in query strings, and TLS connections on deprecated
cipher suites. A web sniffer tool that decrypts HTTPS lets you verify encryption in transit and
confirm certificate pinning works correctly.
Performance Analysis
A sniffer with timing data exposes bottlenecks invisible to application profiling: DNS resolution delays, TLS handshake overhead, slow time to first byte, and oversized payloads. Sorting traffic by duration or size pinpoints the slowest requests across all applications on the machine, not just one browser tab.
Third-Party Traffic Inspection
Desktop applications, SDKs, and browser extensions make HTTP requests you may not expect. A web sniffer running system-wide captures every outbound request, letting you audit what data third-party components send and which domains they contact — critical for compliance audits and data privacy reviews.
HTTP Sniffing Best Practices
These practices save developers hours of unnecessary debugging:
- Always read the response body, not just the status code. Many APIs return a
200
            OK
status code with an error object in the JSON payload. The actual error message is often buried in the body, not reflected in the status code. - Verify your sniffer captures all target processes. A proxy-based sniffer only sees applications that route through it. Background services, CLI tools, and native apps that ignore proxy settings stay invisible. Use a network driver sniffer or confirm every target app respects the proxy.
- Set process or host filters before capturing. A system-wide sniffer without filters shows thousands of requests per minute — telemetry, OS updates, antivirus callbacks. Filter first, then start the session.
- Separate network latency from server processing time. A sniffer shows the total round-trip time — including DNS resolution, TLS negotiation, and network hops. Compare TTFB against total duration to tell whether the delay is on the wire or on the server.
- Account for cached responses. If the sniffer shows no request, the browser likely served
the resource from cache. A
304 Not Modifiedmeans the server confirmed the cache is valid — it is not an error.
Key Features of an HTTP Sniffer Tool
Features that matter most for daily debugging:
- HTTPS decryption — essential for modern web traffic; without it, the tool is limited to plaintext HTTP
- Request/response viewers — structured display of headers, JSON/XML bodies with syntax highlighting, cookies, and URL parameters
- Filtering and search — filter by host, URL, status code, content type, or process name to isolate relevant traffic
- Edit and resubmit — modify captured requests and resend them with different headers or payloads without writing code
- Traffic export — save sessions to JSON, CSV, XML, or Excel for sharing or archiving
- Timing metrics — per-request timing breakdowns and payload sizes for performance analysis
- Process identification — associate each request with the application that sent it
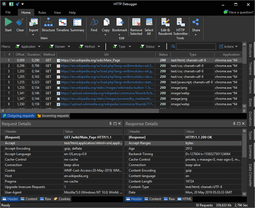
Capturing HTTP Traffic with HTTP Debugger
HTTP Debugger is a Windows HTTP sniffer that uses a network driver instead of a proxy. It captures traffic from all processes on launch — no proxy configuration, no browser extensions, no certificate installation for HTTPS.
Suppose you are debugging a .NET application that calls three internal APIs and two third-party services. A proxy-based tool requires configuring the app to route through the proxy, installing a certificate, and hoping the HTTP client respects proxy settings. With HTTP Debugger, you launch the tool and every request appears in real time — localhost calls, VPN traffic, and connections from processes already running.
Built-in viewers display syntax-highlighted JSON and XML trees, decoded cookies, and parsed URL parameters. Filter by application name to isolate one service, edit a request and resubmit it with modified headers, or export the session in multiple formats. Timing charts flag the slowest requests, and automatic highlighting marks errors and oversized responses.
Frequently Asked Questions
-
What is the difference between an HTTP sniffer and a packet sniffer?
A network packet sniffer captures raw frames across all protocols — TCP, UDP, DNS, ARP. An HTTP sniffer operates at the application layer and captures only HTTP/HTTPS traffic, presenting decoded headers, status codes, and bodies. It trades protocol breadth for a cleaner web debugging experience.
-
Can an HTTP sniffer capture HTTPS traffic?
Yes. Proxy-based sniffers decrypt HTTPS via a man-in-the-middle approach that requires a root certificate. Network driver sniffers like HTTP Debugger decrypt HTTPS transparently without certificate installation. Packet capture tools need the application to export TLS session keys separately.
-
Is HTTP sniffing legal?
Capturing your own traffic for debugging is legal. Intercepting traffic on networks you do not own or without authorization may violate laws such as the Computer Fraud and Abuse Act (US) or the Computer Misuse Act (UK). Always obtain authorization before sniffing on shared networks.
-
How is an HTTP sniffer different from browser DevTools?
DevTools show traffic from the single tab they are attached to. An HTTP sniffer captures traffic system-wide — desktop apps, CLI tools, background services, and all browser tabs at once — including backend-to-backend API calls and webhook deliveries that DevTools cannot see.