Your API returns a 200, but the response body is empty. The CORS preflight passes in development and fails in staging. A background service silently drops requests that never appear in the browser's DevTools. Every one of these problems requires a different kind of HTTP tool - and using the wrong one wastes hours.
What Is an HTTP Tool?
An HTTP tool is any software utility that helps developers send, receive, inspect, modify, or debug HTTP and HTTPS traffic. These tools range from simple command-line clients to full-featured network sniffers that capture all traffic on a machine.
Building a reliable HTTP toolbox - a curated set of utilities that cover different debugging scenarios - is a core skill in professional web development.
Types of HTTP Tools
1. Command-Line HTTP Clients
CLI tools send HTTP requests directly from a terminal. cURL is the most widely installed - it handles dozens of protocols, authentication, and redirects, and pipes output to other commands. HTTPie provides colorized output, implicit JSON support, and cleaner syntax. Both excel in scripting, CI/CD pipelines, and quick requests where a GUI adds overhead.
A common gotcha: cURL defaults to application/x-www-form-urlencoded for POST data. Sending JSON without an explicit Content-Type: application/json header causes silent 400 errors on strict endpoints.
2. GUI API Clients
Graphical clients like Postman, Insomnia, and Hoppscotch offer visual request builders, collections, and team sharing. Features include environment variables, pre-request scripts, test assertions, and code generation in multiple languages.
3. Browser Developer Tools
Every modern browser includes a Network tab that records HTTP requests fired by the current page. Chrome, Firefox, and Edge DevTools display headers, timing waterfalls, WebSocket frames, and payload previews. The limitation: DevTools see only traffic from that browser tab and miss traffic from other applications.
4. Web Debugging Proxies
Proxy-based tools like Fiddler, Charles Proxy, and mitmproxy route traffic through a local server. Once configured, they intercept HTTP and HTTPS traffic, allowing inspection, modification, and replay. The blind spot: applications that ignore proxy settings - CLI utilities, background services, Electron apps - bypass the proxy entirely.
5. HTTP Sniffers (Driver-Based Capture)
Unlike proxies, an HTTP sniffer operates at the network driver level, capturing HTTP traffic from every process - browsers, desktop apps, background services, localhost connections - without proxy configuration.
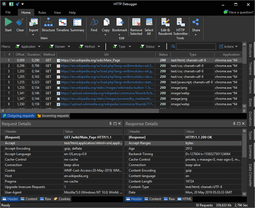
HTTP Debugger is a Windows-based HTTP sniffer that captures traffic system-wide from any process, including non-proxy-aware applications. Built-in viewers display headers, JSON/XML trees, cookies, URL parameters, and POST data in real time.
6. Online HTTP Tools
Web-based services like RequestBin, Webhook.site, and httpbin.org require zero installation. RequestBin and Webhook.site create temporary endpoints that log incoming requests - useful for testing webhooks and OAuth callbacks. The trade-off: online tools cannot inspect local traffic, decrypt HTTPS, or modify requests in transit.
HTTP Tool Comparison by Category
| Category | Examples | Captures All Apps | Modifies Traffic | HTTPS Decryption | Setup |
|---|---|---|---|---|---|
| 1. CLI Clients | cURL, HTTPie | No (sends only) | N/A | N/A | Low |
| 2. GUI Clients | Postman, Insomnia | No (sends only) | N/A | N/A | Low |
| 3. Browser DevTools | Chrome, Firefox | Current tab only | No | Own tab only | None |
| 4. Debugging Proxies | Fiddler, Charles | Proxy-aware apps | Yes | Yes (cert install) | Medium |
| 5. HTTP Sniffers | HTTP Debugger | All processes | Yes | Yes (no cert needed) | Low |
| 6. Online Tools | RequestBin, httpbin | Incoming only | No | No | None |
How to Choose the Right HTTP Tool
- Testing a single API endpoint - cURL or HTTPie for quick terminal requests; Postman or Insomnia when you need saved collections and test automation.
- Debugging front-end requests - browser DevTools show the exact requests your page fires with timing waterfalls and previews.
- Inspecting traffic from desktop apps or services - a debugging proxy works if the application respects proxy settings. For non-proxy-aware apps, a driver-based HTTP sniffer captures what proxies miss.
- Modifying requests or responses on the fly - both proxies and sniffers support this.
- Testing webhooks and callbacks - online tools like RequestBin create disposable endpoints in seconds.
- System-wide traffic analysis - only driver-based sniffers capture all processes without per-app configuration.
Common Mistakes When Selecting HTTP Tools
- Relying on browser DevTools for everything. DevTools cannot see backend services, background processes, or server-to-server calls.
- Assuming a proxy captures all traffic. Non-proxy-aware applications silently bypass the proxy.
- Stacking too many overlapping tools. Pick one CLI client, one GUI client, and one capture tool.
- Skipping HTTPS decryption setup. Without TLS interception, you see connection metadata but not the request and response bodies where bugs hide.
Frequently Asked Questions
-
What is an HTTP tool?
An HTTP tool is software that helps developers send, inspect, debug, or modify HTTP and HTTPS traffic. The six main categories are command-line clients, GUI API clients, browser developer tools, web debugging proxies, HTTP sniffers, and online request services.
-
What is the difference between an HTTP proxy and an HTTP sniffer?
An HTTP proxy routes traffic through a local server, requiring applications to be configured to use it. An HTTP sniffer captures traffic at the network driver level and sees all processes without any configuration.
-
Can HTTP tools decrypt HTTPS traffic?
Yes. Proxy-based tools decrypt HTTPS by installing a root certificate. Driver-based sniffers like HTTP Debugger decrypt HTTPS without requiring per-app certificate installation.
-
Which HTTP tool should a beginner start with?
Browser DevTools for inspecting web page requests. cURL or HTTPie for sending requests from the terminal. Add Postman when you need saved collections and test automation.
-
Can I run multiple HTTP tools at the same time?
Yes, though proxy-based tools may conflict when competing for the same port. Driver-based sniffers operate independently and run alongside any proxy tool without interference.


