What Is HTTP Trace?
An API returns a 500 error with no useful message. A request works in Postman but fails in production. Cookies mysteriously disappear between requests. HTTP trace solves these problems by capturing and analyzing HTTP requests and responses as they travel between client and server, revealing exactly what data leaves your application and what comes back.
The HTTP TRACE method is a specific HTTP verb defined in RFC 9110 that performs a loop-back diagnostic. HTTP tracing as a practice is different: using an HTTP tracer or HTTP tracker tool to capture, inspect, and debug network traffic regardless of which HTTP method the requests use.
How HTTP Tracing Works
An HTTP trace tool intercepts traffic at some point between your application and the network:
- Proxy-based capture routes traffic through a local proxy server. Works well for browser debugging but requires proxy configuration.
- Network driver capture intercepts traffic at the operating system level without acting as a proxy. The application connects directly to the destination server while the tracer observes the traffic transparently.
- Packet-level capture records raw network packets using tools like Wireshark. Provides the deepest visibility but requires decoding protocol layers manually.
HTTP Trace Approaches Compared
| Approach | Setup Complexity | HTTPS Support | Application Impact | Best For |
|---|---|---|---|---|
| Proxy-based (Fiddler) | Medium | Requires certificate install | Changes connection routing | Browser traffic, manual testing |
| Network driver (HTTP Debugger) | Low | Built-in decryption | None - transparent | Desktop apps, .NET, Java |
| Packet capture (Wireshark) | High | Complex key extraction | None | Low-level network issues |
| Browser DevTools | None | Native support | Browser only | Frontend JavaScript debugging |
7 Steps to Trace HTTP Requests
- Choose your tracer based on the target application. Browser-only issues work fine with DevTools. Desktop applications or anything that ignores system proxy settings requires a network-level HTTP trace tool.
- Enable HTTPS decryption. Without decryption, you see encrypted bytes instead of headers and bodies. Proxy-based tools require installing a root certificate. Network driver tools like HTTP Debugger decrypt SSL/TLS traffic automatically.
- Filter by process or domain. Production systems generate thousands of requests per minute. Narrow the capture to your target process or domain before reproducing the issue.
- Reproduce the problem. Perform the exact action that triggers the failure. Avoid unrelated navigation that clutters the trace.
- Inspect the request. Check the URL, method, headers, and body. Common issues: wrong Content-Type header, missing Authorization header, malformed JSON, incorrect query parameters.
- Inspect the response. Look at status code, headers, and body. A 401 means authentication failed. A 403 means you authenticated but lack permission. A 500 with an error message in the body reveals server-side exceptions.
- Compare working vs failing requests. If the same endpoint works sometimes, diff the two requests. The difference often reveals missing cookies, expired tokens, or subtle header variations.
Common Debugging Scenarios
CORS Failures
The browser blocks the request, but the network tab shows nothing useful. An HTTP trace reveals whether the preflight OPTIONS request succeeded, which headers the server returned, and whether Access-Control-Allow-Origin matches your origin.
Authentication Token Issues
The token works in Postman but fails in the application. Trace both requests and compare the Authorization header. Check for whitespace differences, Bearer vs bearer casing, or the token being URL-encoded when it should not be.
Redirect Loops
An HTTP tracer shows the complete redirect chain: the initial request, each 301/302 response with its Location header, and where the loop occurs.
Intermittent Failures
When requests fail randomly, enable continuous tracing and filter by status code. Look for patterns: failures correlating with specific servers, time of day, or request size.
HTTP Trace Tool for Windows
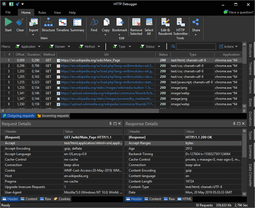
HTTP Debugger captures HTTP and HTTPS traffic without requiring proxy configuration. It works with applications that bypass system proxy settings, including .NET applications, Java programs, and Android emulators. Key capabilities for HTTP tracing include filtering by process name, highlighting slow or failed requests, and exporting traces to JSON or Excel.
Frequently Asked Questions
-
What is the HTTP TRACE method?
HTTP TRACE is a diagnostic HTTP method that echoes the received request back to the client. Most production servers disable it due to Cross-Site Tracing (XST) security concerns.
-
How do I trace HTTPS traffic?
Proxy-based tools require installing a root certificate for man-in-the-middle decryption. Network driver tools like HTTP Debugger decrypt traffic automatically for supported applications without certificate installation.
-
What is the difference between HTTP trace and packet capture?
HTTP tracing captures application-level requests and responses with parsed headers and bodies. Packet capture records raw network frames. HTTP tracing is faster for API debugging; packet capture reveals lower-level network issues.
-
Can I trace HTTP requests from mobile apps?
For Android emulators on Windows, network driver tools capture traffic directly. Physical devices require a proxy-based approach where the device routes traffic through your computer.
-
Why does my tracer show encrypted data?
HTTPS decryption is not enabled. For proxy tools, install the tool's root certificate. For network driver tools, ensure the target application type is selected in the capture settings.


