An API call returns 401 in production, but works on localhost. A browser page loops through 302 redirects, and no one can tell which cookie or header caused the loop. An http viewer gives you the exact request, response, timing, and headers so you can find the failure point in minutes instead of guessing.
What Is an HTTP Viewer?
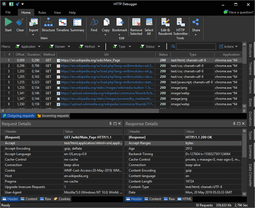
An HTTP viewer is a tool that captures and displays HTTP and HTTPS traffic, allowing developers to inspect requests, responses, headers, cookies, status codes, and payloads. It provides a chronological record of what the client sent and what the server returned, which makes protocol-level debugging repeatable, testable, and faster.
Why Developers Use an HTTP Viewer
Logs show what your application decided to record. Traffic inspection shows what actually crossed the wire. That difference matters when reverse proxies rewrite headers, load balancers terminate TLS, or frontend code sends a stale token.
- Request accuracy: confirm method, URL, query string, and body content sent by the real client.
- Header validation: check
Authorization,Content-Type,Cache-Control, and CORS headers exactly as transmitted. - Cookie behavior: verify
Set-Cookieattributes likeSecure,HttpOnly, andSameSiteagainst browser behavior. - Timing isolation: use per-phase timing (when available) to separate network delay from server processing time.
- Request chain visibility: follow redirects, retries, compression, and status code changes in one timeline.
For header semantics and status code behavior, MDN remains the fastest reference during active debugging: HTTP headers and HTTP response status codes.
7-Step Debugging Workflow with HTTP Debugger Pro
When an API fails or a redirect loop appears, a structured approach saves time. Here is a 7-step workflow using HTTP Debugger Pro to isolate the problem.
Step-by-Step Process
- Launch and capture: Open HTTP Debugger Pro — it starts capturing traffic immediately without proxy configuration.
- Filter by process: Use process filtering to isolate traffic from the failing application and reduce noise.
- Reproduce the failure: Trigger the exact action that causes the error while capture is running.
- Inspect the request chain: Review chronological request numbering to follow redirects, retries, and API calls in order.
- Check headers and cookies: Use built-in viewers for HTTP headers, cookies, and URL parameters to find missing or malformed values.
- Validate response data: Open JSON/XML tree viewers or HTML/CSS/JS viewers to confirm the server returned expected content.
- Save and compare: Save the session to file, apply the fix, then retest and compare results side by side.
This workflow covers most API debugging scenarios: auth failures, redirect loops, caching issues, and payload mismatches. For deeper analysis, use advanced filters by any header parameter to narrow down specific patterns.
When You Need a Full HTTP Request Viewer on Windows
HTTP Debugger Pro is designed for that deeper workflow on Windows as an HTTP request viewer. It captures traffic without changing system proxy settings, decrypts HTTPS traffic, and keeps requests in chronological order so you can track cause and effect across redirects, auth retries, and API fan-out.
Capabilities That Reduce Mean Time to Resolution
- Filter by process name to isolate one app in noisy environments.
- Use advanced filters on any header parameter to quickly narrow sessions.
- Open built-in viewers for headers, cookies, URL params, JSON/XML trees, and HTML/CSS/JS response bodies.
- Save and restore sessions for regression verification and team handoff.
- Edit and resubmit requests to validate fixes without rebuilding clients.
If your team needs repeatable incident reproduction, capture one failing flow, save the session, and replay the request variations. The 7-day trial is available here: Download HTTP Debugger.
Practical Scenario: 302 Loop and Missing Session Cookie
Common real-world pattern: login endpoint returns 302 to dashboard, dashboard returns 302 to login, and the user never reaches an authenticated state. A plain log line that says "login successful" will not reveal this loop. You need an http view of each hop.
Trace Snapshot
1) POST /api/login HTTP/1.1
Host: app.example.com
Content-Type: application/json
Response: 302 Found
Set-Cookie: session=abc123; Path=/; HttpOnly; Secure; SameSite=None
Location: /dashboard

2) GET /dashboard HTTP/1.1
Host: app.example.com
Cookie: (missing session cookie)
Response: 302 Found
Location: /login
Diagnosis: the session cookie is not sent back on the second request. Typical causes are incorrect domain/path scope, missing HTTPS with Secure, or cross-site behavior blocked by SameSite policy. To view http traffic correctly, inspect both request and response headers across the full redirect chain, not just the first response.
Common Mistakes When Inspecting HTTP Traffic
- Checking only one request: many failures happen on the second or third redirect.
- Ignoring upstream rewrites: CDN or ingress layers can alter headers before your app sees them.
- Comparing different clients: browser, mobile SDK, and curl can send different defaults.
- Skipping content-encoding checks: mismatches between declared and actual encoding can hide payload parsing issues.
- Treating 304 as an error: cache revalidation may be working as designed.
FAQ
-
What is the difference between an HTTP viewer and browser DevTools?
Browser DevTools are excellent for frontend debugging within a single browser session. An HTTP viewer is better when you need persistent capture, broad filtering, and traffic analysis across multiple Windows applications, then need to save and share the exact session.
-
Can I debug HTTPS traffic with an HTTP viewer?
Yes, if the tool supports HTTPS decryption. Without decryption, you can still see connection metadata and some headers, but not full encrypted payload details needed for API-level debugging.
-
Why do headers look different after redirects?
Because each redirect is a new request. Authentication headers, cookies, and cache directives can change on every hop, and intermediaries can rewrite values between hops.
-
Is browser DevTools enough for API incident response?
For single-request checks within one browser session, often yes. For multi-step auth flows, traffic across multiple applications, process-level filtering, and repeatable regression checks, a dedicated HTTP viewer like HTTP Debugger Pro is faster and more reliable.
-
Which fields should I inspect first when a request fails?
Start with method, URL, status code,
Location,Authorization,Set-Cookie/Cookie, and response timing. Those fields usually expose auth, routing, and state-management failures quickly.


