- Call HTTP/2 stream · :path
- Metadata request / response headers
- Status trailers · grpc-status
gRPC is a high-performance RPC framework that serializes messages with Protocol Buffers and carries them over HTTP/2. It was developed by Google and open-sourced in 2015; the official site is grpc.io. Unlike WebSocket, which provides a raw channel for streaming unstructured data (usually JSON) over a persistent connection, gRPC focuses on strictly typed remote procedure calls. AI agent backends often use it for typed calls to model, tool, vector search, and inference services.
To debug gRPC calls you cannot just read a URL and a JSON body the way you do with REST — the method lives in an HTTP/2 path, the payload is binary Protobuf wrapped in a length-prefixed frame, and the real outcome is reported in trailers after the response, not in the HTTP status line. The sections below cover what a gRPC call actually looks like on the wire, the practical ways to observe it, and how to inspect live gRPC traffic without standing up a proxy.
What it takes to debug gRPC calls
A gRPC call is a single HTTP/2 stream. The request opens the stream with a HEADERS frame, sends one or more messages in DATA frames, and the server replies with its own HEADERS, DATA, and a final trailing HEADERS frame. Because HTTP/2 multiplexes many streams over one TCP connection, frames from different calls are interleaved on the wire and only the stream ID ties them back together.
The request line you know from HTTP/1.1 is replaced by HTTP/2
pseudo-headers. The RPC method is the :path, formatted as
/package.Service/Method, and the content type is
application/grpc. Here is the logical, decoded view of a
unary call — the bytes are HPACK-compressed and TLS-encrypted on the
actual wire:
# HEADERS frame — request opens the stream
:method: POST
:scheme: https
:path: /routeguide.RouteGuide/GetFeature
:authority: api.example.com:443
content-type: application/grpc
grpc-accept-encoding: gzip, identity
te: trailers

# DATA frame — one length-prefixed gRPC message
# byte 0      : compression flag (0 = none, 1 = compressed)
# bytes 1..4  : message length, big-endian uint32
00 00 00 00 12  <18 bytes of Protobuf>

# HEADERS frame — response
:status: 200
content-type: application/grpc

# HEADERS frame with END_STREAM — gRPC trailers
grpc-status: 0
grpc-message:
The length-prefixed message framing
Every gRPC message inside a DATA frame is wrapped in a 5-byte prefix: one
byte for the compression flag (0 for none, 1 for
compressed) followed by a big-endian 32-bit length. A single DATA frame
can contain several concatenated length-prefixed messages, and one logical
message can also span multiple frames. To read a payload you decode the
prefix, slice out exactly that many bytes, and — if the compression flag
is set — inflate it using the algorithm named in grpc-encoding
(typically gzip or deflate). Only then do you
have the raw Protobuf bytes.
Status lives in the trailers, not the HTTP status
This is the single most common source of confusion. The HTTP/2 response
almost always carries :status: 200, even when the RPC failed.
The real result is the grpc-status code, usually in the
trailing HEADERS frame, with an optional human-readable
grpc-message. Some failures return a trailers-only response,
where grpc-status appears in the only response HEADERS block
with END_STREAM. A call that returns HTTP 200 but
grpc-status: 5 is a NOT_FOUND error, not a
success. The numeric codes are fixed:
| Code | Name | Typical cause |
|---|---|---|
| 0 | OK | Success |
| 3 | INVALID_ARGUMENT | Bad request payload or field |
| 4 | DEADLINE_EXCEEDED | Call exceeded its timeout |
| 5 | NOT_FOUND | Requested entity does not exist |
| 7 | PERMISSION_DENIED | Caller lacks permission |
| 12 | UNIMPLEMENTED | Method/service not registered (often a routing or version mismatch) |
| 14 | UNAVAILABLE | Server unreachable, connection dropped, or overloaded |
| 16 | UNAUTHENTICATED | Missing or invalid credentials metadata |
Why gRPC calls are hard to debug
- The payload is binary. Protobuf has no field names on
the wire — just tag numbers and bytes — so you cannot eyeball it like
JSON without the
.protoschema. - It is encrypted. Production gRPC runs over TLS, so a plain packet capture shows only ciphertext unless you can decrypt it.
- Streams are multiplexed. One connection carries many interleaved calls; reconstructing a single request/response pair means following its stream ID.
- Status hides in trailers. Tools that only show HTTP status will report success on a failed call.
- Client tools only see their own calls. A CLI client tells you what it sends, not what your already-running service or app is actually putting on the wire.
Ways to debug gRPC calls
Each approach answers a different question. Active clients let you make a call; logging and tracing tell you what the process did; on-the-wire capture shows what actually crossed the network.
| Approach | What it shows | Needs .proto? | Sees existing app traffic? |
|---|---|---|---|
| Server logging / interceptors | Decoded messages and status from inside your code | No (you have the types) | Only services you own and can redeploy |
| Manual test clients | Calls you craft, with field-level Protobuf decoding when reflection or a .proto schema is available | Yes, unless server reflection is on | No — only the calls the client itself sends |
Env tracing (GRPC_TRACE, Channelz) | Internal channel/connection state and verbose library logs | No | Only processes you can configure |
| Packet capture | Raw HTTP/2 frames and gRPC messages | Yes, plus a TLS keylog file to decrypt | Yes, but with heavy setup |
| Proxy-less on-the-wire capture | Live decrypted calls reassembled per stream, with status and metadata decoded | No (raw payload bytes today) | Yes — any process on the machine |
For services you own, structured logging interceptors with correlation IDs
are the cheapest win. Manual test clients are useful when you want to
craft a controlled call against a known endpoint, especially when server
reflection or local .proto files are available.
What these approaches do not answer well is the question "what is my running browser, desktop app, or microservice actually sending right now?" That requires capturing the real traffic, already decrypted, off the wire.
Debug gRPC calls with HTTP Debugger
HTTP Debugger captures gRPC traffic and keeps it visible in the same grid as the rest of the session. Each gRPC request shows its method, HTTP version, URL, status, content type, and captured message count, then opens into a dedicated Messages pane for per-message inspection.
-
Reproduce the gRPC call in the client application. HTTP Debugger
shows the captured request in the grid with its HTTP status, gRPC
status, and content type, such as
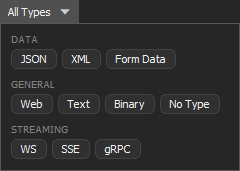
200 / gRPC OKandapplication/grpc, plus the number of messages captured for that request. If the grid contains heavy mixed traffic, click on All Types in the toolbar and select gRPC to see only gRPC rows.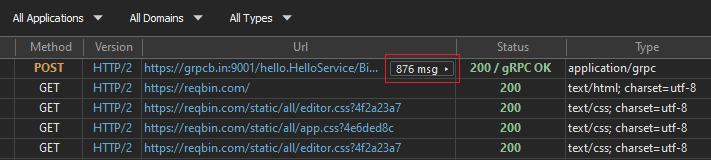
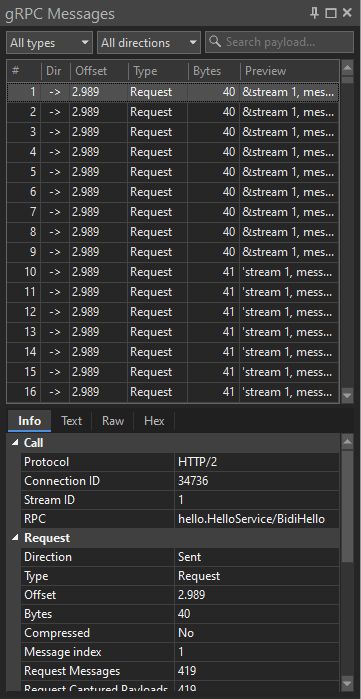
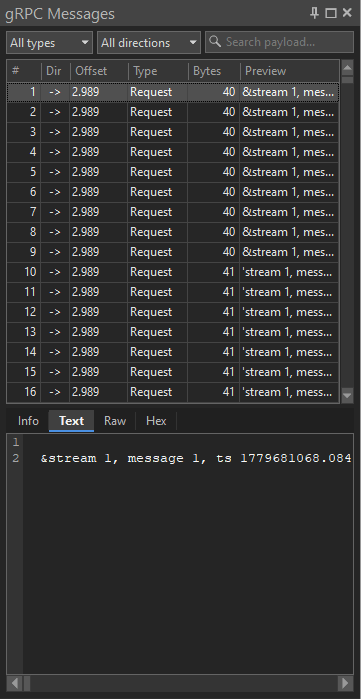
- Click the message-count badge in the gRPC row. HTTP Debugger opens the gRPC Messages pane on the right, with the captured messages for the selected request. You can filter the messages by type, direction, or payload text. Selecting a message shows its details: the Info tab displays protocol, RPC, and message metadata, while Text, Raw, and Hex tabs show the payload in the available formats.
-
The Info tab groups the key gRPC call parameters into Call, Request, Response, and Trailers.
Call
- Protocol — the HTTP version, with the
negotiated ALPN token added when it differs (for example
h2). - Connection ID and Stream ID — the HTTP/2 connection and the individual stream that carried the call.
- RPC — the parsed
service/methodname from the:path.
Request and Response
- Request Messages / Response Messages — the number of logical gRPC messages in each direction: one each for a unary call, many for a streaming call.
- Request Captured Payloads / Response Captured Payloads — the number of message payloads actually captured. Select one in the pane to inspect it.
- Encoding and Accept-Encoding —
the per-message compression, listed alongside the gRPC
metadata headers and the request's
:method,:authority, and:pathpseudo-headers. - gRPC Status and gRPC Message —
the real call result, taken from the response trailers. The HTTP
status is almost always
200whether or not the call succeeded.
Trailers
- Declared Trailers — the trailer names the response promised in its headers, followed by the trailer values that actually arrived after the body.
- Protocol — the HTTP version, with the
negotiated ALPN token added when it differs (for example
Common gRPC debugging scenarios
"The HTTP response is 200 but the client reports an error"
The transport succeeded; the RPC did not. Read the grpc-status
from the trailers. A 12 UNIMPLEMENTED usually means the method
name or package in :path does not match what the server
registered — often a stale stub or a versioning mismatch. A
16 UNAUTHENTICATED points at missing or malformed credentials
in the request metadata.
"Calls intermittently fail with DEADLINE_EXCEEDED"
Use the per-message time offsets to see how long the server took before the deadline fired. If the request messages were sent quickly but the first response message arrives late, the bottleneck is server-side processing, not the client deadline being too aggressive.
"A message body is empty or garbled"
Check the compression flag and grpc-encoding. If a peer sends
compressed messages with an encoding the other side did not advertise in
grpc-accept-encoding, decoding fails. Seeing the raw framing
next to the metadata makes the mismatch immediate.
"Auth works in one client but not another"
Compare the request metadata between the two calls. gRPC credentials
travel as metadata headers (for example authorization);
capturing both calls shows exactly which header is present, missing, or
differently formatted.
Limitations
On-the-wire capture shows you exactly what crossed the network, but it
does not own your schema. Today HTTP Debugger displays binary Protobuf as
raw bytes (hex) rather than decoding it into named fields; text and
JSON-codec payloads render directly. Field-level Protobuf decoding still
requires a schema source such as a .proto file or server
reflection. gRPC traffic in HTTP Debugger is read-only — request
modification and auto-reply rules apply to regular HTTP/HTTPS traffic,
not gRPC streams.
For everything around the call — headers,
timing, sizes, and the raw
HTTP/2 protocol exchange — the
HTTP analyzer and per-request
streaming inspection cover the rest of the
picture. The same workflow applies to the rest of the stack — see the
guides on debugging the
HTTP/2 traffic gRPC rides on, plus
WebSocket connections and
SSE streams.
FAQ
Can I see gRPC calls in browser dev tools?
Only partially, and mainly for browser-originated gRPC-Web traffic. Browser dev tools do not decode a native gRPC client's traffic — the full HTTP/2 stream, binary Protobuf framing, and trailers. For native gRPC, use a tool that captures the client process, reassembles the stream, and decodes the framing.
How do I decode a Protobuf message without the .proto file?
You cannot fully reconstruct field names without the schema, because
Protobuf puts only tag numbers and wire types on the wire. You can
still read raw bytes and partially infer structure from the tags. For
named-field decoding you need the .proto file or server
reflection.
Can packet captures decode gRPC traffic?
Yes, with setup. A packet capture can show low-level HTTP/2 frames
and gRPC framing, but TLS-encrypted traffic must be decrypted first
and field-level Protobuf decoding still needs the matching
.proto schema.
Why does my gRPC call return HTTP 200 but still fail?
Because gRPC reports its result in grpc-status, not the
HTTP status. The HTTP/2 response is normally 200 regardless of the
RPC outcome. A non-zero grpc-status (for example 5
NOT_FOUND or 16 UNAUTHENTICATED) is the actual error, whether it
appears in trailers or in a trailers-only response.