- Connection 1 TCP + TLS · preface
- Streams multiplexed · stream ID
- Frames HEADERS · DATA · RST_STREAM
- Headers HPACK · :pseudo-headers
HTTP/2 is a binary, multiplexed framing protocol with the same request/response semantics as HTTP/1.1: a single TCP connection carries many concurrent streams, headers are compressed with HPACK, and the request and status lines are replaced by pseudo-headers. It is defined in RFC 9113 (header compression in RFC 7541).
Unlike HTTP/1.1, HTTP/2 is not readable straight off the wire. The bytes are framed, the headers are HPACK-compressed against a stateful table, many requests are interleaved on one connection, and the whole exchange usually rides inside TLS. A packet capture without TLS keys shows ciphertext; a decrypted capture still shows HTTP/2 frames and HPACK-compressed headers, not a plain GET line.
Inside an HTTP/2 connection: preface, frames, and streams
An HTTP/2 connection opens with a fixed 24-byte client connection preface:
PRI * HTTP/2.0\r\n\r\nSM\r\n\r\n
A SETTINGS frame from each peer follows the preface. Everything after that
is a stream of binary frames. Each frame has a 9-byte header — a 24-bit
length, an 8-bit type, 8-bit flags, a reserved bit, and a 31-bit stream
identifier — followed by its payload. The types you care about when debugging are
HEADERS and any CONTINUATION frames,
DATA, SETTINGS, WINDOW_UPDATE,
RST_STREAM, and GOAWAY.
A single request/response lives on one stream, identified by its stream ID (client-initiated streams are odd-numbered). HTTP/2 multiplexes many streams over one connection, so frames from different requests are interleaved on the socket, and only the stream ID ties a set of frames back to one logical exchange. Here is the decoded, logical view of a simple exchange:
# Connection preface — client sends 24 fixed bytes first
PRI * HTTP/2.0\r\n\r\nSM\r\n\r\n

# SETTINGS frame — stream 0, connection-wide parameters
SETTINGS_HEADER_TABLE_SIZE: 4096
SETTINGS_INITIAL_WINDOW_SIZE: 65535
SETTINGS_MAX_FRAME_SIZE: 16384

# HEADERS frame — stream 1, opens the request
# (HPACK-compressed and TLS-encrypted on the actual wire)
:method: GET
:authority: web.run
:scheme: https
:path: /

# HEADERS frame — stream 1, response
:status: 200
content-type: text/html; charset=utf-8

# DATA frame(s) — stream 1, END_STREAM set on the last one
<html body bytes>
The same stream-based workflow applies when higher-level protocols use HTTP/2, including gRPC, WebSocket, and Server-Sent Events.
HPACK: why HTTP/2 headers aren't human-readable on the wire
HTTP/2 header blocks are compressed with HPACK, and this is the single biggest reason a naive capture shows nothing useful. HPACK encodes each header field as either an index into a table or a literal, and string values are usually Huffman-coded. There are two tables: a fixed 61-entry static table of common headers, and a per-connection dynamic table that both peers update as the connection runs — a literal header "with incremental indexing" is appended to the dynamic table so later frames can reference it by index alone.
The practical consequence: a header block can depend on earlier header
blocks from the same connection. Literal fields and static-table indexes
can be decoded directly, but any dynamic-table reference only makes sense
if the decoder has processed the earlier updates in order. HTTP Debugger's
HTTP/2 capture layer applies HPACK decoding for the connection, including
Huffman-coded strings and dynamic-table updates, which turns the
compressed wire bytes into the readable :method and
:path rows you see in the header panes.
Pseudo-headers replace the request and status lines
HTTP/2 has no request line or status line. The method, authority, scheme,
and path move into request pseudo-headers
(:method, :authority, :scheme,
:path), and the response status becomes :status.
Pseudo-headers always start with a colon, always come before regular
headers, and every regular header name is lowercase. A request that would
read GET / HTTP/1.1 with a Host header is
instead four colon-prefixed fields.
One detail that trips up per-stream tools: the response starts with a
HEADERS block that contains :status and response headers, but
not the request method or path it answers. HTTP Debugger keeps the request
and response associated by stream ID, so a captured response is linked to
the request it replied to instead of being an orphaned 200.
Ways to debug HTTP/2 traffic
Each approach answers a different question. Client tools let you make a request; logs tell you what the server decoded; on-the-wire capture shows what actually crossed the network.
| Approach | What it shows | Setup cost | Sees existing app traffic? |
|---|---|---|---|
| Browser DevTools (Network) | Decoded headers and body for browser-origin requests, with a protocol column | None | Browser tab only — not other processes |
curl --http2 -v / nghttp -v | Frames and decoded headers for calls you craft | Low (CLI) | No — only the calls the tool itself sends |
| Network protocol analyzers | Raw HTTP/2 frames with frame reassembly and HPACK decoding | High — needs TLS session secrets, commonly a keylog file | Yes, but only if decryption material is available |
| Server / proxy logs | What the server stack decoded after the fact | Redeploy or reconfigure | Only services you own |
| Proxy-less HTTP Debugger capture | Logical HTTP/2 exchanges reassembled per connection and stream, HPACK decoded | No proxy or keylog; HTTPS decryption requires the local certificate to be trusted | Yes — any process on the machine |
A network protocol analyzer is excellent once it can decrypt, but the
gating problem is decryption material: a browser can export
SSLKEYLOGFILE, while many desktop apps, services, and
runtimes are not configured to export TLS keys, so the capture stays
encrypted. What none of these tools answer well is
"what is my already-running app actually sending over HTTP/2 right
now?" That requires capturing the real traffic and reconstructing the
HTTP/2 exchanges from the connection.
Debug HTTP/2 traffic with HTTP Debugger
HTTP Debugger captures HTTP/2 traffic from any process on the machine without a proxy, decrypts HTTPS with its own local root certificate, and decodes HPACK so headers are readable. It identifies an HTTP/2 connection by the client preface in the decoded connection stream and records the negotiated ALPN token, the per-connection Connection ID, and each request's Stream ID alongside the rest of the session.
-
Reproduce the request in your app or browser. HTTP Debugger shows
each captured HTTP/2 request as a normal row in the main grid. The
Version column confirms
HTTP/2, and the method, URL, status, and content type are ready to inspect.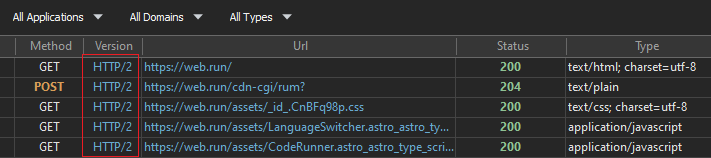
-
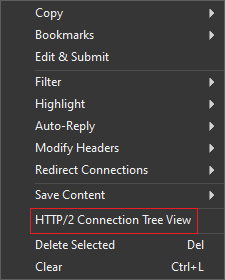
HTTP Debugger has two ways to show captured traffic. The flat list
is useful for general debugging when the problem is not specific to
HTTP/2. For HTTP/2 analysis, optimization, and protocol-specific
issues, switch to HTTP/2 Connection Tree View to see
exactly how requests share a connection. This view groups the
session by connection: each parent row is one HTTP/2 connection, and
its children are the streams multiplexed over it, each with its
request target and status.
-
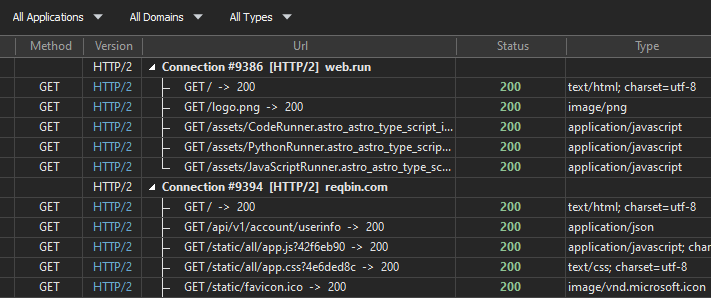
Open the Summary pane for a captured request to see its details, including HTTP/2 connection information. The Connection section shows:
- Protocol — the negotiated application protocol,
HTTP/2here. - Connection ID — the connection this stream rode on; every multiplexed request on that socket shares the value.
- Stream ID — the individual HTTP/2 stream that carried this request.
- Protocol — the negotiated application protocol,
-
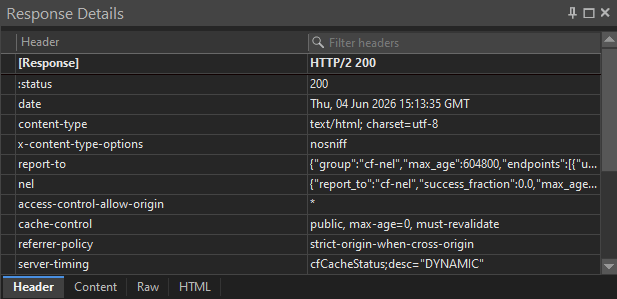
The Request and Response header
panes show HPACK-decoded headers with pseudo-headers first. The
request pane shows
:method,:authority,:scheme, and:pathabove the regular lowercase headers; the response pane shows:status. The fields are fully decoded, so you can filter, copy, and compare them like any other request. This pane is where you confirm an:authoritymismatch or a missingauthorizationheader.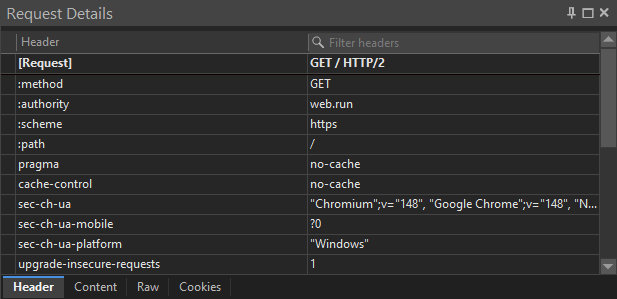
Modifying HTTP/2 traffic
HTTP Debugger can modify HTTP/2 request/response traffic: update headers, return custom responses, and redirect connections.
- Modify Headers — add, change, or drop request and response HTTP headers on matching HTTP/2 traffic, including pseudo-headers where the protocol allows it.
- Auto-Reply — return a canned response (custom status, headers, body, a local file, or a redirect) for matching requests without the server ever being hit.
- Redirect Connections — send matching host/port traffic somewhere else, for example pointing a production hostname at a local build.
Limitations
HTTP Debugger reads HTTP/2 at the protocol layer, not your application's schema, and capture is Windows-only. For everything around the requests — timing, sizes, cookies, and the decoded HTTP protocol details — the HTTP analyzer and per-request panes cover the rest of the HTTP traffic picture.
FAQ
How do I see which HTTP/2 stream a request used?
Select the request and read the Connection ID and Stream ID from the Summary pane's Connection section. All requests multiplexed over the same socket share the Connection ID, while the Stream ID is unique to each exchange. The HTTP/2 Connection Tree View groups the grid by connection so you can see every stream that shared one.
Why are HTTP/2 headers lowercase and prefixed with a colon?
HTTP/2 requires lowercase header field names and replaces the request
and status lines with pseudo-headers that start with a colon —
:method, :authority, :scheme,
and :path on the request, and :status on
the response. They must appear before regular headers in the block.
Can I see HTTP/2 traffic with a network protocol analyzer?
Yes, but only after decryption. A network protocol analyzer parses HTTP/2 frames and reassembles HPACK, yet production HTTP/2 usually runs over TLS, so it needs TLS session secrets to read application data. A browser can export a keylog file; most desktop apps, services, and runtimes cannot, which is when a system-wide capture that decrypts with its own local certificate is the practical option.
Why is a captured HTTP/2 header empty or missing?
That usually points to an HPACK state problem in the decoder. If a packet analyzer or per-stream decoder starts mid-connection, or drops a frame that updates the dynamic table, later indexed fields can resolve to the wrong value or to nothing at all. HPACK decoding needs the connection state in order, so capturing the full connection is the most reliable way to keep the header table correct.
Can I modify HTTP/2 requests, not just inspect them?
Yes, for HTTP/2 request/response traffic. HTTP Debugger can modify headers, return custom responses, and redirect connections. Header changes follow HTTP/2 pseudo-header rules.
Can I modify gRPC, WebSocket, or SSE streams over HTTP/2?
No. HTTP Debugger can inspect gRPC, WebSocket, and Server-Sent Events streams over HTTP/2 in read-only mode, but it cannot modify them.
Does HTTP Debugger support HTTP/3?
No. HTTP/3 runs over QUIC on UDP and is a separate transport from HTTP/2's TCP framing. HTTP Debugger captures HTTP/1.x and HTTP/2. HTTP/3 is not supported yet.