- Handshake HTTP upgrade / CONNECT
- Open 101 / 200
- Frames text · binary · ping / pong
- Close code 1000–1015
WebSocket is a full-duplex, bidirectional protocol that keeps a persistent channel open over a single, long-lived TCP connection. A connection begins as an ordinary HTTP request and then upgrades in place to a persistent channel, after which either side can send a message at any time without waiting for the other.
Unlike a REST request/response pair — or the strictly typed remote procedure calls of gRPC — WebSocket is a raw channel that carries whatever framing your application puts on it, most often JSON, sometimes binary. Many UIs for AI agents use the WebSocket protocol for live status messages, tool-call events, and interrupts.
To debug a WebSocket connection you cannot just read a URL and a response body the way you do with REST. The useful signal is spread across two layers: the handshake that opens the channel — an HTTP/1.1 upgrade or an HTTP/2 extended CONNECT — and every frame that flows over it afterward, including data frames, keepalives, and a final close code. The sections below cover what a WebSocket connection actually looks like on the wire, the frame and close-code details that explain real failures, and how to inspect live WebSocket traffic without a proxy or browser extension.
What to inspect when you debug a WebSocket connection
A complete WebSocket debugging pass covers four layers, listed here in the order the connection builds them — though a close code, when you have one, is usually where you start:
- The handshake — either the HTTP/1.1
GETrequest withUpgrade: websocketand a101 Switching Protocolsresponse, or the HTTP/2CONNECTrequest with:protocolset towebsocketand a:statusof200. If this fails, no frames are ever exchanged. - Data frames — the
TextandBinarymessages your application actually sends and receives, plus their direction and timing. - Control frames —
Ping/Pongkeepalives and theCloseframe, which explain idle drops and disconnects. - The close code — the numeric reason the connection ended, which is often the single most useful clue.
How the WebSocket protocol works under the hood
Most connection bugs are easier to read once you know what the bytes mean. WebSocket is defined by RFC 6455, and compression by RFC 7692.
The HTTP/1.1 upgrade handshake
A WebSocket often begins as an ordinary HTTP/1.1 request. The client sends
an Upgrade request with a random
Sec-WebSocket-Key; the server confirms with
101 Switching Protocols and a matching
Sec-WebSocket-Accept. The accept value is not a secret — it
is the SHA-1 hash of the client key concatenated with the fixed GUID
258EAFA5-E914-47DA-95CA-C5AB0DC85B11, Base64-encoded. A
mismatched or missing accept header means a proxy or server mangled the
handshake.
GET /chat HTTP/1.1
Host: example.com
Upgrade: websocket
Connection: Upgrade
Sec-WebSocket-Key: dGhlIHNhbXBsZSBub25jZQ==
Sec-WebSocket-Version: 13
Sec-WebSocket-Extensions: permessage-deflate

HTTP/1.1 101 Switching Protocols
Upgrade: websocket
Connection: Upgrade
Sec-WebSocket-Accept: s3pPLMBiTxaQ9kYGzzhZRbK+xOo=
The same handshake also carries the negotiated subprotocol
(Sec-WebSocket-Protocol) and extensions
(Sec-WebSocket-Extensions). Reading these
HTTP headers tells you whether
compression was actually agreed, not just requested.
WebSocket over HTTP/2
WebSocket can also run over HTTP/2
using extended CONNECT. In that flow there is no
101 Switching Protocols response. The client opens an HTTP/2
stream with :method set to CONNECT and
:protocol set to websocket; the server accepts
it with :status: 200. After that, the HTTP/2 stream carries
the same WebSocket frame format: text, binary, continuation, ping, pong,
and close frames.
# HTTP/2 request headers
:method: CONNECT
:scheme: https
:authority: example.com
:path: /chat
:protocol: websocket

# HTTP/2 response headers
:status: 200
Frame anatomy and opcodes
After the WebSocket is established, data travels in frames rather than
messages. Each frame begins with a FIN bit (is this the last
fragment?), three reserved bits — RSV1 marks the first frame
of a compressed message when permessage-deflate is used — a
4-bit opcode, a MASK bit, and a payload length encoded in 7,
7+16, or 7+64 bits. The opcode decides how to read the rest:
| Opcode | Type | Purpose |
|---|---|---|
0x0 | Continuation | Next fragment of a split message |
0x1 | Text | UTF-8 text payload |
0x2 | Binary | Raw binary payload |
0x8 | Close | Closing handshake, carries a close code |
0x9 | Ping | Keepalive probe |
0xA | Pong | Reply to a ping |
Two details commonly cause confusion. First, every client-to-server frame
is masked: the payload is XOR-ed with a 4-byte key, so a
raw capture of an outgoing frame looks like noise until it is unmasked.
Server-to-client frames are never masked. Second, a single logical message
can be fragmented across one initial frame
(FIN=0) and any number of Continuation frames,
which is why a payload may appear to arrive in pieces.
Control frames and compression
Ping and Pong frames keep an otherwise idle
connection alive; if a load balancer or proxy times out before the next
ping, you get an abnormal close. A Close frame carries a
2-byte close code followed by an optional UTF-8 reason string. When
permessage-deflate is negotiated, individual text and binary
messages can be DEFLATE-compressed. The first frame of a compressed message
sets the RSV1 bit; continuation frames inherit that compressed
message state even though they do not set RSV1 themselves. The
client_no_context_takeover and
server_no_context_takeover parameters control whether the
compression window resets between messages. A capture that does not inflate
those messages shows compressed bytes instead of your JSON.
WebSocket close codes worth knowing
These are the close codes you will see most while debugging:
| Code | Name | What it usually means |
|---|---|---|
| 1000 | Normal Closure | Connection finished cleanly |
| 1001 | Going Away | Server shutting down or client navigated away |
| 1002 | Protocol Error | A frame violated the protocol |
| 1005 | No Status Received | Closed without a status code — set locally, never sent on the wire |
| 1006 | Abnormal Closure | No close frame received — network drop, crash, or proxy timeout |
| 1009 | Message Too Big | Payload exceeded the peer's limit |
| 1011 | Internal Error | Unhandled exception on the server |
| 1015 | TLS Handshake | wss:// TLS negotiation failed |
Codes 1005, 1006, and 1015 are never sent on the wire —
the browser or runtime sets them locally when no real close frame arrived.
That is why a 1006 never has a reason string: the connection
died before a Close frame could be exchanged. To find the
cause, you have to look one layer down at the handshake, the last frames
before the drop, and the keepalive timing — not at the close event itself.
How to debug WebSocket connections step by step
There are two ways to debug a WebSocket connection. If it already closed, you have a close code — read it first and work backward. When nothing has clearly failed, make a full pass through the steps below in order.
- Confirm the handshake.
For HTTP/1.1, verify the request carries
Upgrade: websocketand the response is101 Switching Protocolswith a validSec-WebSocket-Accept. For HTTP/2, verify:method: CONNECT,:protocol: websocket, and:status: 200. A redirect, forbidden response, or ordinary200 OKHTTP/1.1 page means the WebSocket setup was blocked or rewritten upstream. - Read the frames in order.
Follow sent and received frames on a single timeline, checking opcode
and direction so you can see which side stopped talking and when.
Remember that client-to-server frames are masked, so a raw outgoing
payload looks like noise until it is unmasked, and a single message can
span an initial frame plus
Continuationframes. - Decode the payload.
Inflate frames marked as compressed after
permessage-deflatenegotiation and pretty-print JSON so you compare application data, not compressed bytes. Confirm text frames are valid UTF-8. - Check keepalive and close.
Look at
Ping/Pongspacing for idle drops, and read theClosecode and reason to separate a clean shutdown from a network or server failure.
Ways to debug WebSocket connections
Each approach sees a different slice of the connection. Browser tooling is closest at hand but only for pages you load yourself; packet capture sees everything but at a low level; in-app logging shows decoded messages but only for code you control.
| Approach | What it shows | Sees non-browser traffic? | Decrypts wss://? |
|---|---|---|---|
| Browser DevTools (WS filter) | Decoded, inflated frames for pages you load yourself, in a Messages view | No — only the page's own connections, and not ones opened before DevTools attached | Yes — the browser already holds the TLS keys |
| Packet capture (Wireshark) | Raw WebSocket frames at the network layer, with manual reassembly | Yes, but with heavy setup | Only with a TLS key-log file from the client |
| Client-side / library logging | Messages your own code sends and receives, already decoded | Only apps you own and can instrument | N/A — it reads payloads in-process, above TLS |
| System-wide capture (HTTP Debugger) | Live frames from any process, decoded and inflated, beside the rest of the session | Yes — any process on the machine | Yes — via a local root certificate, no proxy |
Browser DevTools is the fastest path for a page you control, and a packet capture is the most thorough at the network layer. The gap each one leaves is the WebSocket you cannot load in a tab or instrument yourself.
From the shell, the fastest first check is to open the handshake directly with a CLI client:
wscat -c wss://api.example.com/chat
If wscat (or websocat) completes the handshake
and echoes messages but your app does not, the difference is on the client
— headers, subprotocol, or auth. If the handshake fails here too, the
problem is the server or a hop in between. A CLI client confirms the
upgrade and prints decoded messages, but it does not show frame internals
like opcodes, masking, or compression — for that you need a capture.
Debug WebSocket connections with HTTP Debugger
HTTP Debugger captures WebSocket traffic and keeps it visible in the same grid as the rest of the session. Each connection shows its method, URL, status, type, size, and timing, then opens into a dedicated Messages pane for per-frame inspection.
-
Reproduce the WebSocket issue or workflow in the client
application. HTTP Debugger shows the captured WebSocket setup
request in the grid with its method, URL, status, type, size,
timing, and session metadata.
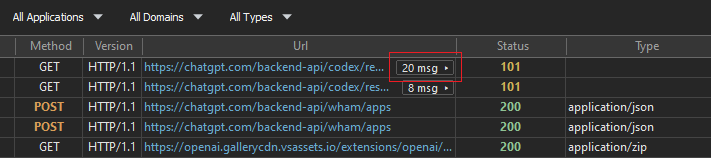
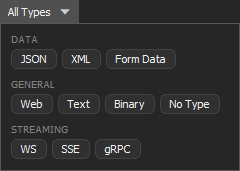
If the grid contains heavy mixed traffic, click on
All Types in the toolbar and select
WS to see only WebSocket rows.
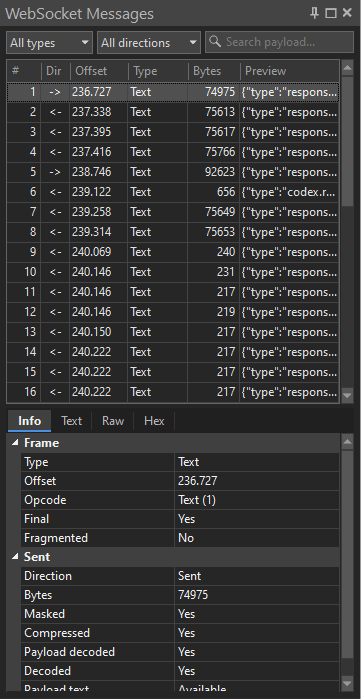
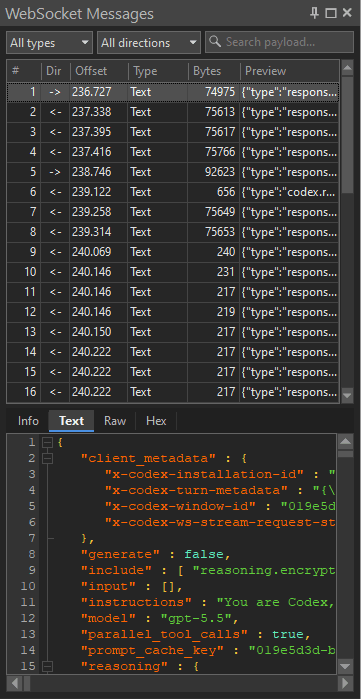
- Click the message-count badge in the WebSocket row. HTTP Debugger opens the Messages pane on the right, with sent and received frames for the selected connection. You can filter the messages by type, direction, or payload text. Selecting a frame shows its details: the Info tab displays protocol and frame metadata, while Text, Raw, and Hex tabs show the payload in the available formats.
-
The Info tab shows metadata for the selected WebSocket frame. For WebSocket rows, HTTP Debugger groups these details as Frame plus Sent or Received fields, depending on the frame direction.
Frame
- Type and Opcode — the frame
kind, such as
Text,Binary,Close,Ping,Pong, orContinuation, plus the numeric opcode. - Offset — when timing is available, the frame's time offset within the captured session.
- Final and Fragmented — whether this frame completes the message and whether the logical message spans continuation frames.
- Close code and Close reason —
for
Closeframes, the shutdown code and optional reason string that explain why the connection ended.
Sent or Received
- Direction and Bytes — whether the frame was sent by the client or received from the server, and the captured payload byte count shown for that frame.
- Masked — whether the payload was masked on the wire. Client-to-server frames are masked; server-to-client frames are not.
- Compressed, Payload decoded, and Compression — whether the frame is marked as compressed, whether the delivered payload is already decoded, and the compression mode when HTTP Debugger can determine it.
- Decoded and Payload text — whether the selected payload can be shown as readable text, plus any text-decoding status such as invalid UTF-8 or a compressed payload that is not decoded.
- Type and Opcode — the frame
kind, such as
The same connection's setup headers and frames sit next to the rest of your captured session, alongside the HTTP traffic DevTools cannot attach to, so one capture covers both.
Common WebSocket debugging scenarios
"The connection closes immediately with 1006"
A 1006 right after opening usually means the handshake never
really succeeded or was torn down before any frame arrived. Confirm a
101 (or HTTP/2 200) actually came back; a
redirect, a 200 OK HTML page, or a stripped
Sec-WebSocket-Accept means a proxy or gateway intercepted the
upgrade. For wss://, a failure during TLS surfaces locally as
1015.
"Messages stop arriving after a while"
Look at the Ping/Pong spacing leading up to the
silence. When an idle connection sends no keepalives, a load balancer or
reverse proxy will close it on its own timeout — often surfacing as
1001 or a bare 1006 with no reason. The gap
between the last data frame and the drop tells you whether it was idle.
"The handshake returns 200 or a redirect instead of 101"
The request never reached the WebSocket endpoint as an upgrade. An
authenticating proxy, a CDN, or a gateway handled it as plain HTTP and
stripped the Upgrade and Connection headers, or
routing sent it to a default handler. Compare the request headers that left
the client with the response: if Upgrade: websocket went out
but did not come back acknowledged, the hop in between is the suspect.
"The payload looks like binary garbage"
Either the message is genuinely binary (opcode 0x2), or
permessage-deflate was negotiated and the frame is
DEFLATE-compressed with RSV1 set on the first frame. Inflate
it before judging the contents; only then can you tell corrupt data from
compressed-but-valid JSON.
"It works locally but breaks behind a proxy"
Reverse proxies and load balancers are the most common cause of WebSocket
failures that never reproduce on localhost. They may not forward the
Upgrade header, may buffer frames instead of streaming them,
or may apply an idle timeout shorter than your keepalive interval. Capture
the connection through the proxy and compare its handshake headers and
frame timing against a direct connection.
Limitations
System-wide capture shows exactly what crossed the wire, but it does not rewrite it. WebSocket traffic in HTTP Debugger is read-only: it decodes and inspects frames rather than injecting or modifying them, and the Auto-Reply and HTTP Modifier rules apply to regular HTTP/HTTPS traffic, not WebSocket frames. Frame decoding also has size and format limits, so very large or unusual payloads may show as raw bytes rather than fully decoded text. Capture is Windows-only and reads the connection at the protocol layer, not your application's message schema. For everything around the frames — headers, timing, sizes, and the raw HTTP protocol exchange — the HTTP analyzer and the system-wide HTTP sniffer cover the rest. The same workflow applies to the rest of the stack — see the guides on debugging the HTTP/2 traffic a connection can ride on, plus gRPC calls and SSE streams.
FAQ
How do I see the messages in a WebSocket connection?
Open a frame timeline for the connection — the Messages view in DevTools, or the Messages view in a system-wide capture tool — and read sent and received frames in order, with their opcode, direction, size, and decoded payload.
Can I debug secure wss:// WebSocket traffic?
Yes. After the TLS layer is decrypted — via the browser's TLS key log for packet captures, or a local root certificate in HTTP Debugger — wss:// frames are inspected exactly like plaintext ws:// frames.
Can I debug WebSockets outside the browser?
Browser DevTools only sees WebSockets from pages it is attached to. For desktop apps, background services, CLI tools, or emulators, use a system-wide capture tool such as HTTP Debugger Pro that intercepts traffic from any process on the machine.
Does WebSocket work over HTTP/2?
Yes, through extended CONNECT. Instead of an HTTP/1.1
101 Switching Protocols upgrade, the client opens an
HTTP/2 stream with :method: CONNECT and
:protocol: websocket, and the server accepts it with
:status: 200. After that the stream carries the same
WebSocket frame format — text, binary, continuation, ping, pong, and
close.
What does WebSocket close code 1006 mean?
1006 is an abnormal closure: the connection dropped
without a Close frame, so the browser or runtime set the
code locally and there is no reason string. It usually points at a
network drop, a crash, or a proxy or load-balancer idle timeout. To
find the cause, look at the handshake, the last frames before the
drop, and the Ping/Pong spacing rather than
the close event itself.