- Request GET · text/event-stream
- Stream open HTTP response
- Events data · id · retry
- Close clean · truncated
Server-Sent Events (SSE) is a one-way streaming protocol: the server holds
a single HTTP response open and pushes a sequence of text events to the
client, which reads them through the browser's EventSource
API. Data flows from server to client only, over ordinary HTTP.
Unlike WebSocket, which opens a full-duplex channel through its own upgrade handshake, SSE needs no protocol upgrade and reconnects automatically, so it travels through proxies and CDNs as a plain HTTP response. AI assistants lean on it for token, tool-progress, and status streams, where data only ever flows one way.
To debug an SSE stream you cannot just read a URL and a response body the way you do with REST — the response never ends, and the useful signal is spread across three layers: the headers that put the connection into streaming mode, the individual events as they arrive, and how the stream finally closes.
How to debug SSE streams
A complete SSE debugging pass looks at four layers, in order:
- The response headers -
Content-Type: text/event-streamplusCache-Control: no-cache. If the content type is wrong, the browser never treats the body as an event stream and no events fire. - The events - the
data,event,id, andretryfields the server actually writes, plus the blank line that dispatches each event. In AI-agent streams, event names often separate tokens, tools, and status updates. - Reconnection state - the last
idthe client saw and theretryinterval, which decide what happens after a drop. - How the stream ends - whether the server closed cleanly or the connection was cut mid-event, which is often the single most useful clue.
How Server-Sent Events work on the wire
Most streaming bugs are easier to read once you know what the bytes mean. SSE is defined by the WHATWG HTML specification, and the client API is documented on MDN.
One long-lived HTTP response
An SSE stream starts as an ordinary GET request with
Accept: text/event-stream. The server replies
200 OK with Content-Type: text/event-stream and
then keeps the body open - it keeps writing into the same response for
as long as the connection lasts. Over HTTP/1.1 the body is delivered with
chunked transfer encoding; over HTTP/2 it is a stream that stays open. For
reliable incremental delivery, check whether the response is sent with
Content-Encoding: identity or no content-encoding header. A
gzip or Brotli layer in the server, proxy, or CDN path can buffer output
and delay events that should arrive one at a time.
The event stream format
The body is UTF-8 text parsed line by line. Each non-empty line is a
field: value pair, a leading : marks a comment
(often a keepalive), and a single optional space after the colon is
stripped. Four fields are defined:
| Field | Purpose |
|---|---|
data | The payload; repeat it to build a multi-line value joined with \n |
event | Names the event so the client can listen for a custom type; defaults to message |
id | Sets the event ID the client remembers for reconnection |
retry | Reconnection delay in milliseconds (digits only) |
The detail that trips people up is dispatch: an event is only delivered
when the parser hits a blank line. A block with
data lines but no trailing empty line sits in the buffer and
the client sees nothing. A leading UTF-8 byte order mark is stripped once,
and unknown fields are ignored rather than rejected.
GET /events HTTP/1.1
Accept: text/event-stream

HTTP/1.1 200 OK
Content-Type: text/event-stream
Cache-Control: no-cache
Connection: keep-alive

: keepalive comment - ignored by the client

event: message
data: {"text":"Review Summary"}

id: 42
event: progress
data: {"done":30}
data: {"total":100}

retry: 3000
Reconnection: id, Last-Event-ID, and retry
Reconnection is built into the protocol, which is the main reason teams
pick SSE over a raw socket. Whenever the server sends an id,
the client stores it; if the connection drops, the browser reconnects
automatically and replays the stored value in a
Last-Event-ID request header so the server can resume from
where it left off. The retry field overrides the default
reconnection delay. The catch worth debugging: replay only works if the
server actually honors Last-Event-ID - many deployments send
IDs but never resume, so events are silently lost across a reconnect.
SSE vs WebSocket
SSE is server-to-client only and uses ordinary HTTP, so it passes through proxies, CDNs, and load balancers without a protocol upgrade and uses the browser API's built-in automatic reconnection. WebSocket is full-duplex but needs an upgrade handshake and its own reconnection logic. For live dashboards, notifications, log tails, and AI assistant responses - anywhere data flows one way - SSE is simpler and easier to debug.
Why SSE streams are hard to debug
Most "my EventSource never fires" reports are not application bugs - they are usually caused by something between the server and the client buffering or rewriting the stream. The usual suspects:
- Proxy buffering. Nginx buffers proxied responses by
default, so events pile up in the buffer and the client sees nothing for
minutes; you need
X-Accel-Buffering: noorproxy_buffering off. Some CDN and cache configurations can buffer responses too, so verify that the route really streams rather than assuming every hop passes chunks through immediately. - A missing blank line. Forgetting the second newline after an event is the most common SSE bug - the event never dispatches and the stream looks dead.
- The wrong Content-Type. Anything other than
text/event-streamin the response HTTP headers means the browser does not parse the body as events. - Compression in the path. A gzip or Brotli layer added by the server or a proxy can buffer the stream while compressing it and delay incremental delivery.
- CORS. A cross-origin stream needs the right
Access-Control-Allow-Origin; the connection fails before the first event with only a genericerrorevent on the client. - The HTTP/1.1 connection cap. Browsers allow about six connections per origin; several open SSE streams plus normal requests can exhaust the pool. HTTP/2 multiplexing removes that HTTP/1.1 browser connection cap, though deployments can still enforce their own concurrent stream limits.
The hard part is that the browser's error event is opaque -
it tells you the connection failed, not why. You need to see the raw
stream on the wire to distinguish a buffering proxy, a missing newline,
and a truncated response.
Ways to debug an SSE stream
| Method | Good for | Limitation |
|---|---|---|
| Browser DevTools (EventStream tab) | A page you load yourself in the browser | Browser tabs only; Chrome's view is bare and shows nothing for non-browser clients |
curl -N | Confirming the raw bytes and headers from the shell | Manual, no per-event view, no decryption of another app's HTTPS |
| System-wide capture (HTTP Debugger) | Any process, including HTTPS, localhost, and HTTP/2 | Windows only; inspects rather than modifies the stream |
From the shell, the fastest first check is to read the stream directly:
curl -N -H "Accept: text/event-stream" https://api.example.com/events
The -N flag disables curl's own output buffering, so events
print as they arrive. If they appear here but not in your app, the problem
is on the client; if they stall here too, it is the server or something
buffering in between.
How to debug an SSE stream step by step
- Confirm the response headers.
Verify the response is
200withContent-Type: text/event-streamand no compression. A wrong content type or aContent-Encoding: gzipheader explains a stream that never starts. - Watch events arrive in real time. Follow events on a timeline as they stream in. If the headers look right but no events appear, suspect proxy buffering or a missing blank line between events.
- Read each event's fields and payload.
Check the
eventtype,id, and thedatapayload - pretty-printed when it is JSON - so you compare application data instead of scanning raw stream text. - Check reconnection and how the stream ends.
Confirm the
id/Last-Event-IDandretrybehavior across a reconnect, and check whether the stream closed cleanly or was cut off mid-event.
In the browser, Firefox and Chrome DevTools expose received events under the Network tab when you select the stream request. That works for pages you load yourself. It does not help when the stream is consumed by a desktop app, a background service, a CLI tool, a mobile emulator, or one backend calling another - and it cannot show a stream that opened before DevTools was attached.
Debug SSE streams with HTTP Debugger
HTTP Debugger captures Server-Sent Events streams and keeps them visible in the same grid as the rest of the session. Each captured stream shows its method, URL, status, type, size, and timing, and a dedicated Server-Sent Events pane breaks it down event by event.
-
Start the SSE request from the client application or browser. HTTP
Debugger captures it as a grid row showing method, URL, status,
type, size, and timing, and a
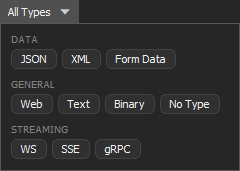
text/event-streamresponse marks it as an SSE stream with an event-count badge. If the grid is busy, click All Types and select SSE under Streaming to filter to event streams.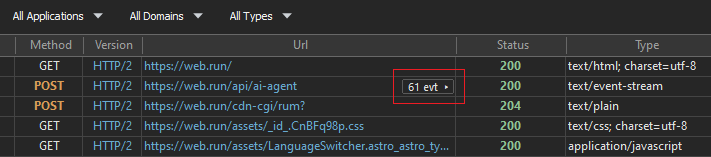
-
Click the event-count badge in the SSE row. HTTP Debugger opens the
Server-Sent Events pane on the right: a timeline of
events for
the selected stream with a sequence number, direction, time offset,
event type, byte size, and a payload preview. You can filter the
events and search across payloads. Selecting an event shows its
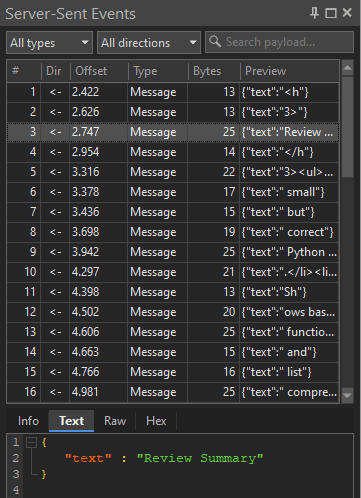
detail in the Info, Text,
Raw, and Hex tabs —
Text renders the
datapayload and auto-formats it when it is JSON, while Raw reconstructs theid,event, anddatalines exactly as they came off the wire, so you can confirm the field structure the server sent.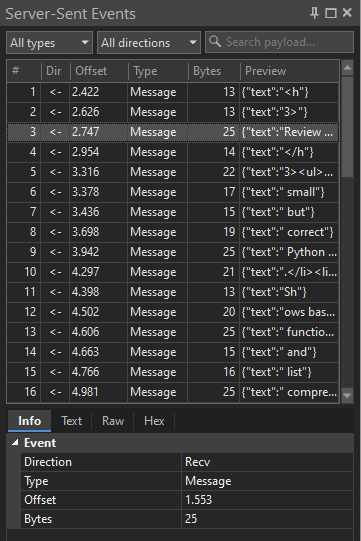
-
The Info tab is the first of the per-event tabs. For an SSE stream it groups the selected event's metadata under a single Event section:
- Direction — always
Recv; an SSE stream is server-to-client only. - Type — the event kind shown in the timeline:
the custom event name, or
Messagewhen the server set none. - Offset — the event's time offset within the captured session, when timing is available.
- Bytes — the captured
datapayload size for that event. - Event and ID — the raw
eventandidfield values, listed only when the server sent them.
The stream's summary also records whether it ended cleanly or was truncated — the signal that separates a normal close from a connection cut mid-event.
- Direction — always
Common SSE debugging scenarios
"EventSource fires no events"
The connection opens but no message events arrive. Check the
response first: anything other than Content-Type:
text/event-stream means the browser never parses the body as
events, and a Content-Encoding: gzip layer can buffer the
whole stream before the first event escapes. If the headers look right,
confirm each event ends with a blank line — a block of data
lines with no trailing newline never dispatches.
"Events arrive in a burst instead of streaming"
Events show up, but all at once after a delay rather than one at a time.
That is buffering between the server and the client, not an application
bug. Run curl -N against the endpoint: if the burst happens
there too, the cause is upstream — Nginx proxy_buffering, a
CDN, or a compression layer holding the bytes — so set
X-Accel-Buffering: no or disable buffering on the hop that
stalls.
"The stream dies after about a minute of silence"
A stream that drops on a fixed interval is usually hitting a proxy or
load-balancer idle timeout. SSE has no built-in ping, so a quiet stream
looks idle to every hop in the path. Send a periodic comment line
(: keepalive) so the connection keeps producing bytes, and
compare the timeout against the gap before the drop.
"It reconnects, but events are lost"
The browser reconnects automatically and replays the last
id in a Last-Event-ID request header, but replay
only works if the server honors it. Many deployments emit id
values and then ignore the header on reconnect, so the events produced
during the drop are never resent. Confirm the server actually resumes from
Last-Event-ID rather than restarting the stream.
"DevTools shows nothing, but the stream works"
Browser DevTools only sees streams from the page it is attached to. A stream consumed by a desktop app, a background service, a CLI tool, a mobile emulator, or one backend calling another never appears there, and neither does a stream that opened before DevTools was attached. Use a system-wide capture that reads the events from any process on the machine.
Limitations
System-wide capture shows exactly what crossed the wire, but it does not rewrite it. SSE traffic in HTTP Debugger is read-only: it inspects and decodes events rather than injecting or modifying them, and the Auto-Reply and HTTP Modifier rules apply to regular HTTP/HTTPS traffic, not event streams. Capture is Windows-only and reads the stream at the protocol layer, not your application's event schema. It complements browser tooling: use DevTools for a page you control, and the system-wide HTTP sniffer when the stream lives outside the browser or rides encrypted HTTP traffic you cannot attach DevTools to. For everything around the events — headers, timing, sizes, and the raw HTTP protocol exchange — the HTTP analyzer covers the rest. The same workflow applies to the rest of the stack — see the guides on debugging the HTTP/2 traffic an SSE stream can ride on, plus WebSocket connections and gRPC calls.
FAQ
How do I view the events in an SSE stream?
Open the stream request in your browser's Network tab to read
received events, or use curl -N -H "Accept:
text/event-stream" URL from the shell to print them as they
arrive. For a stream from a non-browser process, use a system-wide
capture tool that lists each event with its type, size, and payload.
Why is my SSE connection hanging with no events?
If the connection opens but no events arrive, the cause is almost
always buffering or framing. Check that a proxy is not buffering the
response (disable Nginx proxy_buffering or set
X-Accel-Buffering: no), that each event ends with a
blank line, and that no hop in the path compresses the stream.
What is the difference between SSE and WebSocket?
SSE is one-way, server-to-client over plain HTTP with automatic reconnection built in. WebSocket is full-duplex but needs an upgrade handshake and its own reconnection logic. Use SSE when data flows in one direction; use WebSocket when both sides need to send.
Can I debug SSE over HTTPS or from a non-browser app?
Yes. Browser DevTools only sees streams from pages it is attached to. For desktop apps, services, CLI tools, or backend-to-backend calls, use a system-wide capture tool such as HTTP Debugger Pro that decrypts HTTPS with a local root certificate and shows events from any process on the machine.
Does SSE work over HTTP/2?
Yes. SSE is plain HTTP, so it runs over HTTP/2. Multiplexing removes the roughly six-connection-per-origin limit that browsers impose on HTTP/1.1, although servers and intermediaries can still enforce concurrent stream limits.