- Launch HTTP Debugger capture on & MCP on
- Reproduce Issue browser · desktop app
- Ask AI Agent read & analyze · via MCP
- Cause Identified from real traffic
The Model Context Protocol (MCP) is an open standard, defined in the MCP specification, that lets an AI assistant such as Claude Code or Codex call external tools and read external data through a uniform interface. HTTP Debugger ships an MCP server, so you can debug HTTP traffic with AI agents on real captured traffic: the agent gets access to the session on your machine, which holds what every process sent and received.
What an AI agent cannot see on its own
An agent observes the processes it starts. Everything else on the machine is invisible to it: the browser tab reproducing the bug, a .NET service started by Windows, an Electron app, a vendor CLI, an installer. Asking the agent about that traffic produces a theory, not an observation.
In some cases the agent can reproduce the issue on its own, running curl or a script. In others only you can: a login in the browser, a click in a desktop app, an installer reaching a vendor endpoint. Either way the traffic ends up in the same session and is analyzed the same way.
HTTP Debugger MCP server tools
HTTP Debugger exposes eight MCP tools to AI agents, each covering a different part of the open session:
| Tool | What it does |
|---|---|
get_capture_status | Reports whether capture is running and the number of captured transactions |
diagnose_capture | Explains why there is no traffic, or why HTTPS is not decrypted |
list_endpoints | Lists the endpoints in the session, most used first |
list_transactions | Lists transactions with their metadata and body sizes |
search_transactions | Searches URLs, headers, and bodies across the session |
get_transaction | Returns the transaction details: its headers and the request or response body |
get_session_stats | Summarizes the session: counts, hosts, methods, and byte totals |
export_as_curl | Rebuilds a captured request as a cURL command line to replay or edit |
How to turn on the MCP server
For security reasons, the MCP server ships turned off, so you need to enable it before an agent can read the session.
-
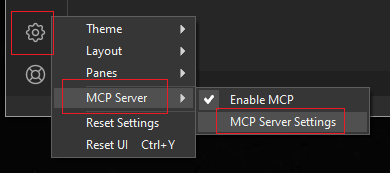
Open the settings menu in the left toolbar, point at
MCP Server, and turn the server on by clicking
Enable MCP. To open the server settings, select
MCP Server Settings in the same submenu.
-
In the MCP Server Settings dialog you can turn the server on or off, check its status, and copy the configuration for your agent.
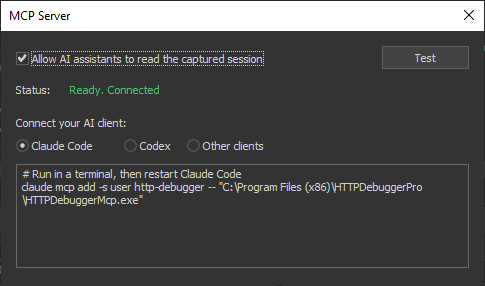
Add the MCP server to Claude Code:
claude mcp add -s user http-debugger -- "C:\Program Files (x86)\HTTPDebuggerPro\HTTPDebuggerMcp.exe"Add the MCP server to Codex:
# %USERPROFILE%\.codex\config.toml
[mcp_servers.http-debugger]
command = "C:\\Program Files (x86)\\HTTPDebuggerPro\\HTTPDebuggerMcp.exe"
args = []
Add the MCP server to any other MCP client:
Server name: http-debugger
Executable: C:\Program Files (x86)\HTTPDebuggerPro\HTTPDebuggerMcp.exe
Arguments: (empty)
Transport: stdio
Prerequisites: HTTP Debugger running; MCP enabled
Restart the client after adding the server.
-
The status bar shows
MCP: ONwhile the server is enabled. Once an agent starts calling the tools, it switches to a counter, for exampleMCP: 50 Calls.
A practical example: two callers, one endpoint, both 200 OK — analyzed by an AI agent
A page returns the account of the logged-in user. A curl call to the same
endpoint gets nothing back, and both report 200 OK. The
screenshot below shows both calls captured in HTTP Debugger, one from
chrome.exe, one from curl.exe.
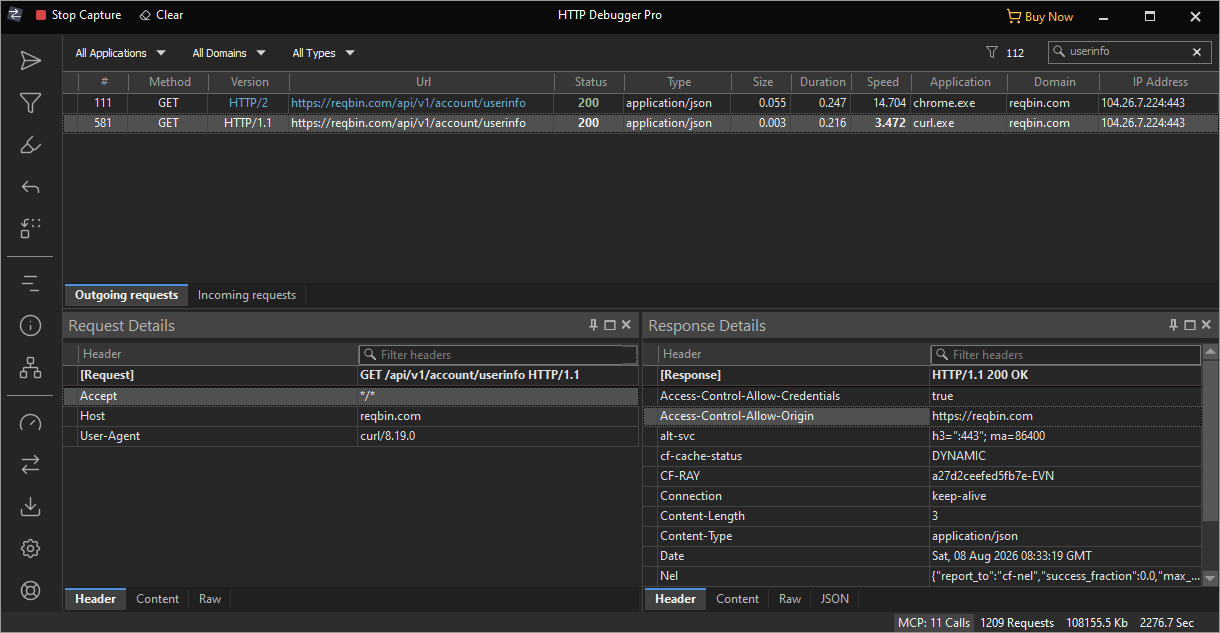
Same URL, same status, different result. Nothing in the columns explains why the second call comes back empty.
The MCP server was connected to Claude Code, and the agent was asked to find out the difference:
My curl gets {} back from https://reqbin.com/api/v1/account/userinfo,
but the same endpoint returns my account when the page loads in the browser.
Both say 200 OK. What's different?
After reading the traffic captured in HTTP Debugger over MCP, the agent answered:
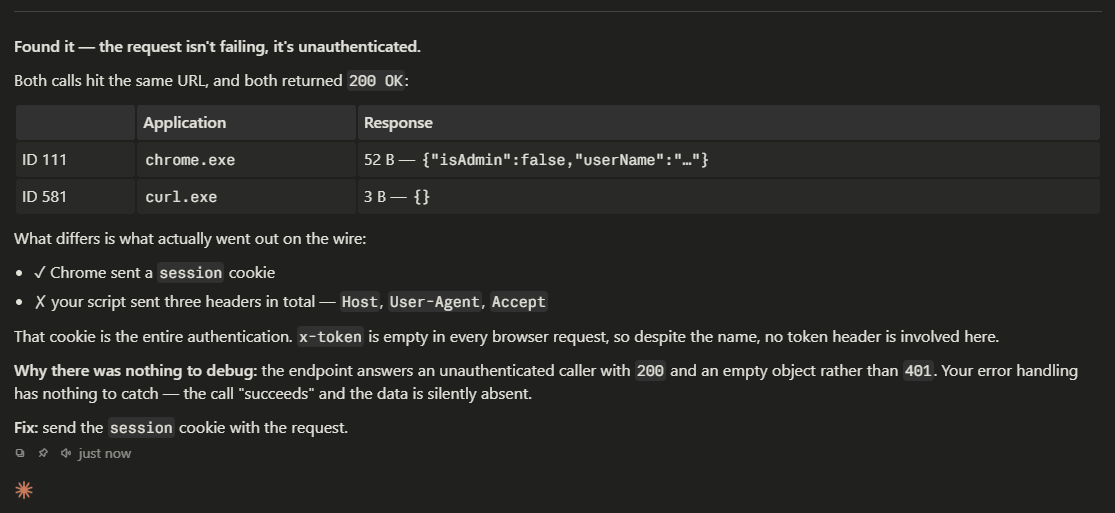
The agent found that two requests to
one endpoint differ by a single header, the session cookie
the browser sends and curl does not. The endpoint answers an
unauthenticated caller with 200 and an empty body instead of
401, so status checks pass, no exception is raised, and the
logs record a successful call.
Requirements and limits
To analyze traffic with AI agents, HTTP Debugger has to be running with capture on and MCP enabled. The agent gets the same transactions you see in the UI, WebSocket, SSE, and gRPC included. The server accepts connections only from the machine it runs on: a capture holds real cookies, tokens, and authorization headers, and that data must not be reachable over the network.
FAQ
Can an AI agent see traffic from my browser?
Yes. HTTP Debugger captures browser traffic like any other process, and the agent reads that session over MCP.
Can the agent replay a captured request?
Yes. The agent can export any captured
request as a cURL command
with export_as_curl, edit the command parameters, and
send the request again.
Which AI clients work with the MCP server?
Any MCP client that can start a local server over stdio. The dialog has ready-to-paste configuration for Claude Code and Codex, and the generic settings for every other client: server name, executable path, no arguments, stdio transport.
Why does the agent report no tools after I add the server?
An MCP client reads its server list at startup, so a client that was already running does not see the new entry until you restart it.