- Authorize GET /authorize browser redirect
- Callback GET /callback browser redirect with code + state
- Token POST /token direct call with code_verifier
An OAuth 2.0 or OIDC login flow consists of three requests: the authorization request, the redirect back to your callback, and the back-channel token exchange. To debug the flow, you inspect these real HTTP requests. HTTP Debugger captures traffic from every process on the machine, letting you debug every step of the login flow, even when it spans a browser and a desktop app.
A broken login usually surfaces as one unhelpful string, such as
redirect_uri_mismatch, invalid_grant, or a
401 after sign-in. The real cause is spread across a browser
redirect, a server-to-server token call, and sometimes a desktop or SDK
request. Reading each request and response on the wire turns that single
error into a specific, fixable diagnosis.
Why OAuth 2.0 and OIDC flows are hard to debug
The authorization code flow, defined in
RFC 6749 §4.1,
is not one request. It spans two channels. The
front channel runs in the browser: a redirect to the
identity provider's /authorize endpoint, the user consent
screen, and a redirect back to your redirect_uri carrying the
authorization code.
The back channel is a direct server-to-server (or
client-to-server) POST to the token endpoint that swaps the
code for an access_token, and in
OpenID Connect
an id_token. The request that fails is often the one you
cannot see.
- Browser DevTools sees only the front channel. The Network panel captures requests the browser makes. But an OAuth flow crosses origins, so the authorize request, the callback, and any hops can land in separate tabs. Each clears on navigation unless Preserve log is on. The back-channel token exchange from your backend or a desktop SDK never appears there at all.
- Online OAuth debugger tools fire a synthetic request.
Browser-based OIDC debuggers build and send their own
/authorizerequest with theredirect_uripointed at their domain. That is useful for crafting a request, but it shows what the tool sent, not what your running application put on the wire, and it never sees the token exchange. - Non-browser clients are invisible to browser tools. Desktop apps, Windows services, CLI utilities, and native SDK clients that run an OAuth flow do not route through DevTools, so their authorize and token requests go unseen.
What to inspect in an OAuth 2.0 / OIDC flow
Three requests carry the whole flow, and a single wrong field in any of
them breaks the login. The authorize request opens the flow, the callback
delivers the code, and the token request redeems it. Read
these parameters across all three:
| Parameter | Where it appears | What to verify |
|---|---|---|
response_type=code | Authorize | Code flow requested; OIDC also needs scope=openid |
client_id | Authorize + Token | Matches the registered client on both requests |
redirect_uri | Authorize + Token | Identical string in both, and registered with the provider |
scope | Authorize | Includes openid for OIDC; requested scopes granted |
state | Authorize + Callback | Returned value equals what you sent (CSRF check) |
nonce | Authorize + id_token | Echoed into the id_token (OIDC replay check) |
code_challenge / code_challenge_method | Authorize | PKCE challenge present; method S256 |
code | Callback + Token | Single-use; redeemed once, quickly |
code_verifier | Token | Hashes to the code_challenge under S256 |
access_token / id_token | Token response | Present on success; the id_token is a JWT (OIDC) |
Proof Key for Code Exchange (PKCE), defined in
RFC 7636,
ties the front-channel and back-channel requests together: the
authorize request carries a code_challenge, and the token
request must carry the matching code_verifier.
Capture the full OAuth 2.0 flow with HTTP Debugger
HTTP Debugger captures HTTP and HTTPS traffic from every process on the machine, including browsers and desktop apps. That puts the browser redirects and the token exchange in the same capture, so you can debug the whole login in one place.
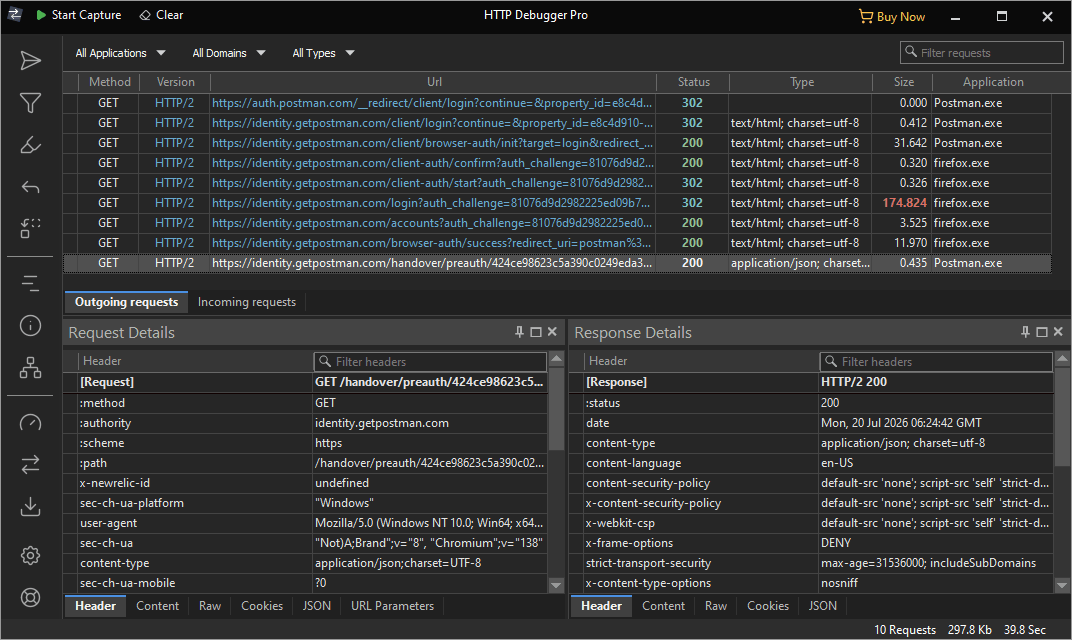
- Start HTTP Debugger and sign in to reproduce the failing login. Every request from the flow lands in the main grid as its own row: the browser redirects and the back-channel token call. The Application column names the process behind each row, so you can tell the browser's requests from the ones your desktop app or backend made.
-
Click the
GET /authorizerow and open its URL parameters view. It breaks the query string into fields, so you readclient_id,redirect_uri,scope(openidfor OIDC),state, and the PKCEcode_challengewithout unescaping%2Fby hand. Note the exactredirect_uri; you compare it against the token request in step 4.GET /authorize?response_type=code&client_id=s6BhdRkqt3&redirect_uri=https%3A%2F%2Fapp.example.com%2Fcallback&scope=openid%20profile&state=af0ifjsldkj&code_challenge=E9Melhoa2OwvFrEMTJguCHaoeK1t8URWbuGJSstw-cM&code_challenge_method=S256 HTTP/1.1 Host: id.example.com -
Click the callback row (the
GETto yourredirect_uri). Confirm the returnedstateequals the value the authorize request sent (a mismatch means CSRF or a dropped session), and that an authorizationcodeis present. A callback served by a local server on127.0.0.1appears under the Incoming requests tab. You see the code arrive even with no browser tab to inspect.GET /callback?code=SplxlOBeZQQYbYS6WxSbIA&state=af0ifjsldkj HTTP/1.1 Host: app.example.com -
Click the HTTP POST row to the
token endpoint. Read its form-encoded body:
grant_type=authorization_code, thecodefrom the callback, theredirect_uri, and the PKCEcode_verifier. Put thisredirect_urinext to the one from the authorize request. Here they differ: authorize sent/callback, the token request sends/callback/.POST /token HTTP/1.1 Host: id.example.com Content-Type: application/x-www-form-urlencoded grant_type=authorization_code&code=SplxlOBeZQQYbYS6WxSbIA&redirect_uri=https%3A%2F%2Fapp.example.com%2Fcallback%2F&code_verifier=dBjftJeZ4CVP-mB92K27uhbUJU1p1r_wW1gFWFOEjXk&client_id=s6BhdRkqt3 -
Select the token response and read the Response pane. It returns
400 invalid_grant, and the decrypted JSON names the cause: theredirect_uridoes not match the authorization request. That is the trailing slash from step 4. Make both values byte-identical: drop the/so the token request also sends/callback. Reproduce the login, or resend the corrected request from the Submitter (below) for a200without signing in again.HTTP/1.1 400 Bad Request Content-Type: application/json { "error": "invalid_grant", "error_description": "redirect_uri does not match the authorization request" }
Common OAuth errors and how to spot them in traffic
OAuth error responses are terse by design. invalid_grant and
invalid_client come from
RFC 6749 §5.2,
while redirect_uri_mismatch is a common provider-specific
variant. Each code below points at a specific request to read on the wire.
| Error | Where it appears | Likely cause and fix |
|---|---|---|
redirect_uri_mismatch | Authorize or token response |
The redirect_uri differs between the authorize and
token requests, or is not registered (trailing slash, http vs
https, port, or case). Some providers return this as
invalid_grant. Make both values byte-identical and
register the exact URI.
|
invalid_grant | Token response |
The authorization code expired, was already used, the
code_verifier does not match the
code_challenge, or the clock skew is too large. Redeem
the code once and quickly, and verify the PKCE pair.
|
invalid_client | Token response |
Wrong client_id/client_secret or the wrong
token-endpoint authentication method. Check the client credentials
in the request body or Authorization header.
|
state mismatch | Callback |
The returned state does not equal the value sent
(possible CSRF or a lost session). Persist and compare
state per request.
|
401 + invalid_token | API call after login |
The WWW-Authenticate: Bearer header reports a missing,
expired, or malformed access token. Re-check the
Authorization: Bearer header and the token expiry.
|
The Authorization: Bearer scheme and the
WWW-Authenticate error codes
(invalid_token, insufficient_scope) are defined in
RFC 6750.
For how those headers are structured, see the
HTTP header reference.
Capturing at the system level, rather than tunneling through a proxy, means you are not altering the login you are trying to debug. The no-proxy vs proxy debugging trade-offs cover why that matters for corporate SSO and VPNs. The token exchange runs over HTTPS, so if it shows up still encrypted, trusting the local root certificate is what turns decryption on.
Test how your client handles auth failures with HTTP Debugger
Reading the flow shows what happened; forcing a failure shows how your client reacts. In HTTP Debugger, two rule-based features let you provoke auth errors without touching the identity provider.
- Drop or alter auth data with the
HTTP Modifier. Use
rules to remove the
Authorizationheader, corrupt aBearertoken, or change a cookie on matching requests, then watch whether your client surfaces a clean error or hangs. - Mock the token endpoint with
Auto-Reply. Return a
canned response (a
400with{"error":"invalid_grant"}or a500) for the token request, so you can test retry, refresh, and error-handling paths against failures that are otherwise hard to reproduce on demand.
Replay the fix
Once the wire tells you which field is wrong, confirm the fix without
rerunning the whole login. Send the captured token request to the
Submitter, correct the parameter (here, drop the trailing slash so the
redirect_uri is identical to the authorize request), and
resubmit. A 200 with an access_token (and an
id_token for OIDC) confirms the exchange now works. The
Submitter can send the request in explicit HTTP/1.1 or HTTP/2 mode to match
the endpoint.
FAQ
How do I debug an OAuth 2.0 flow?
Capture the three requests that make up the flow and read them in
order: the authorization request to /authorize, the
redirect back to your redirect_uri with the
code and state, and the back-channel
POST to the token endpoint. Check the parameters in each
request, then read the error code in the token response
(invalid_grant, redirect_uri_mismatch, or
invalid_client) to pinpoint the failure.
Why do I get a redirect_uri mismatch error?
The redirect_uri in the request does not exactly match a
URI registered with the provider, or it differs between the authorize
request and the token request. When redirect_uri was
sent in the authorize request, RFC 6749 requires the token request to
use an identical value. A trailing slash, an http vs https scheme, a
different port, or a case difference is enough to fail. Capture both
requests and compare the redirect_uri character for
character.
Can I debug OAuth or OIDC without a proxy?
Yes. HTTP Debugger captures the OAuth and OIDC requests system-wide without setting a system proxy or a browser extension, so it does not interfere with the corporate proxy, VPN, or SSO involved in the login you are debugging. It decrypts HTTPS with its own local root certificate once that certificate is trusted.
What is PKCE and how do I verify it in the traffic?
PKCE (RFC 7636) protects the authorization code by binding it to a
secret. The authorize request sends a code_challenge
with code_challenge_method=S256, and the token request
sends the code_verifier. To verify it on the wire,
confirm the challenge is present on the authorize request and that
the token request includes a code_verifier that hashes
to that challenge; a failed match returns invalid_grant.