HTTP Debugger Since 2007
Explore two decades of HTTP Debugger, from its early releases to today
HTTP Debugger launched in 2007 as a compact HTTP-only traffic viewer. Since then, it has grown into a full-featured, system-wide debugger for developers, QA and DevOps. It supports HTTPS, HTTP/2, WebSocket, Server-Sent Events and gRPC, provides a built-in MCP server for AI assistants, and remains under active development.
Below is a brief history of HTTP Debugger in screenshots.
-
Version 10 introduces a redesigned interface with support for HTTP/2, WebSocket, Server-Sent Events and gRPC. The updated capture engine handles heavy traffic more efficiently, negotiates TLS 1.3 directly and supports OCSP stapling. AI assistants can connect to HTTP Debugger through a built-in MCP server. 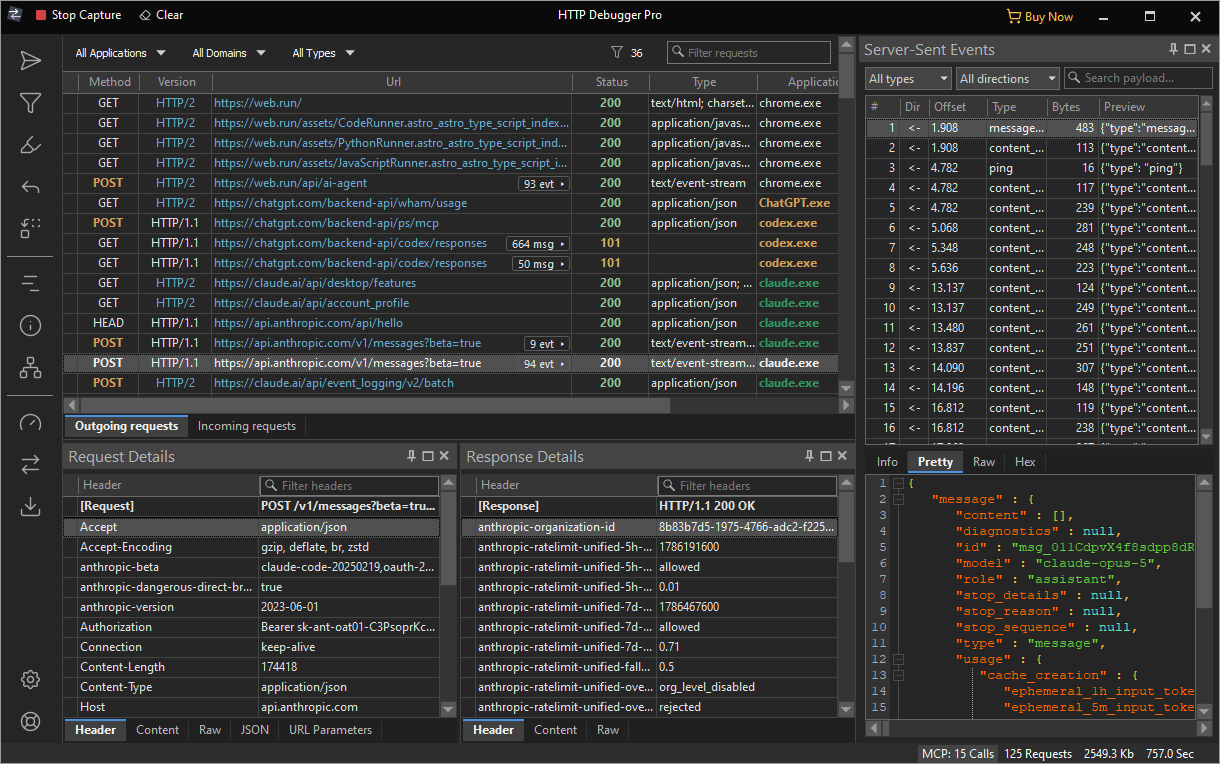
-
Version 9 focused on reliability across traffic capture and request testing. It added support for client certificates and introduced safeguards against memory exhaustion during large capture sessions. The HTTP Submitter became more reliable, and compatibility issues with Windows 11 were fixed. 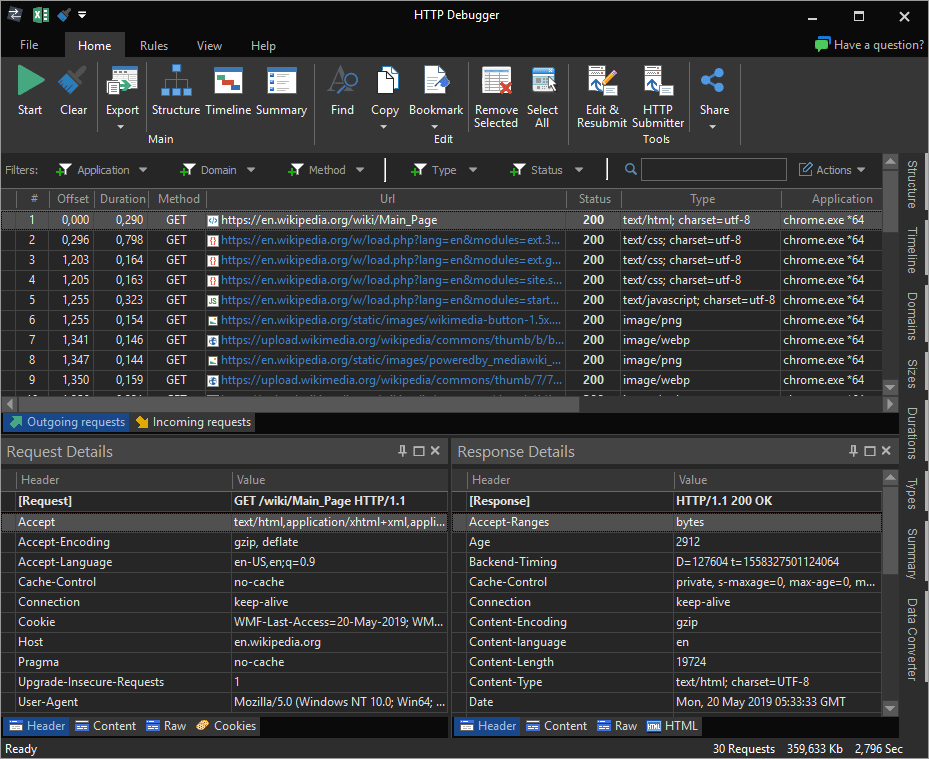
-
Version 8 added a Structure pane for viewing captured traffic in both stream and tree formats and introduced Quick Filters to make relevant traffic easier to find. HTTP Submitter gained drag-and-drop editing and the ability to save and load requests. Captured HTML could be previewed directly in the app, and syntax highlighting was improved. 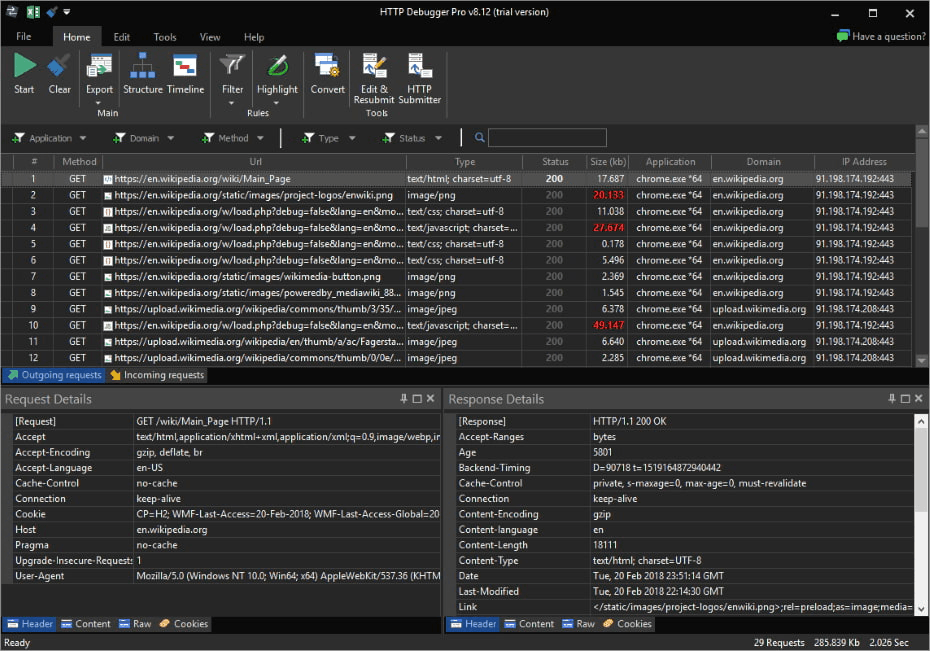
-
Versions 6 and 7 introduced Edit & Reply, Auto-Responder, HTTP Modifier and TCP/IP Redirector tools. The interception engine was rewritten for more reliable HTTPS decryption, and HTTP Debugger gained WebSocket support. New tree views, timelines and charts made captured traffic easier to analyze. The interface gained a new Ribbon design and dark and light themes. 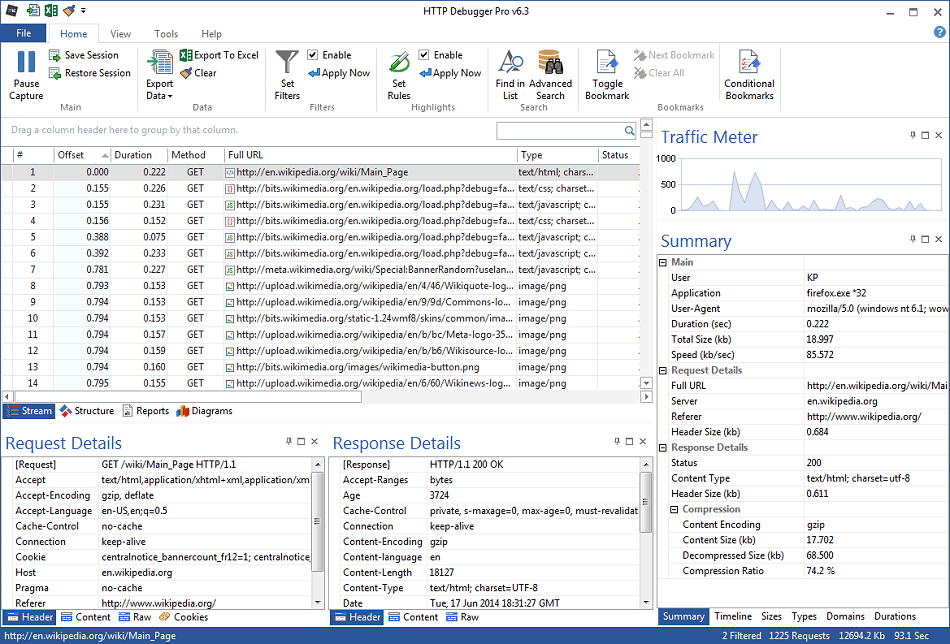
-
Version 4 added capture for locally running web servers and introduced Conditional Bookmarks to automatically mark matching requests and responses. In version 5, the interface and interception engine were completely reworked, and HTTPS inspection was added for Chrome and Opera. 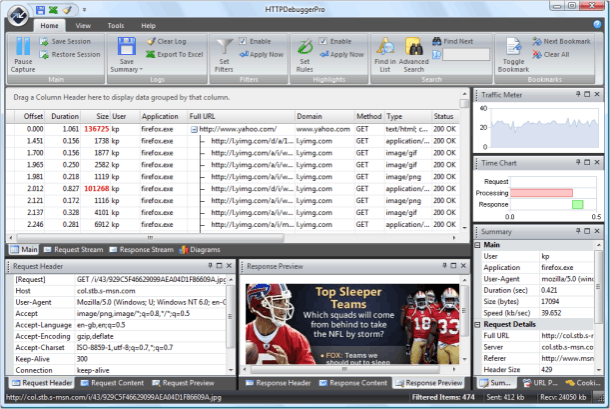
-
Version 2 added HTTPS inspection for Firefox and Internet Explorer and introduced HTTP Submitter. Dedicated panes were added for headers, content, URL parameters and cookies. Version 3 added session files that could be saved, reopened and shared for remote debugging, as well as tree views and exportable reports. Charts and diagrams were added to visualize captured traffic. 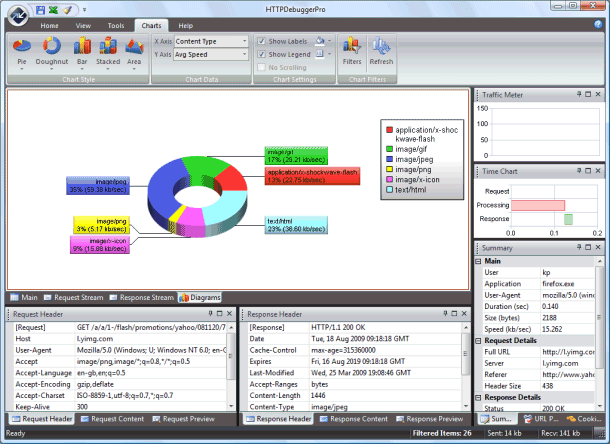
-
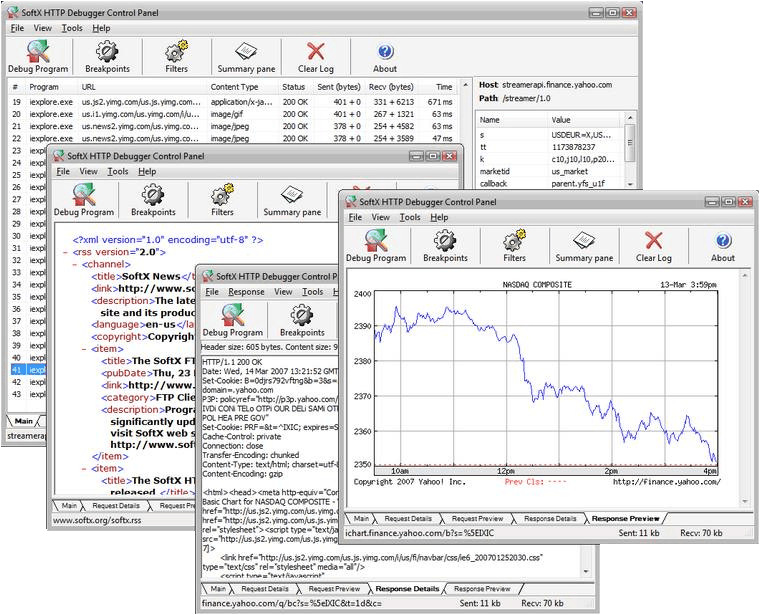
Before becoming a standalone product in 2007, HTTP Debugger began as an internal tool for debugging HTTP traffic across several projects and was initially published on SoftX.org. Unexpected interest from users led to its move to a dedicated domain, HTTPDebugger.com, and continued development into a full-featured debugging tool. The first standalone version could capture only HTTP traffic, decode gzip and chunked responses, and provide basic filters and traffic viewers.